

In this tutorial, we will learn how to install Grafana on Ubuntu/Debian.
What is Grafana?
Let’s first learn about Grafana. Data analytics lets you analyze raw data and make conclusions about it. Grafana is used for analyzing raw data and use extensively in data analytics.
It is the multi-platform open-source analytics software invented in 2014. Grafana is the presentation platform or observability platform that provides interactive visualization in the form of graphs and charts. It also monitors infrastructure, databases, and applications.
Don’t confuse yourself between Kibana and Grafana. The basic difference is that Grafana is used to analyze and visualize metrics of CPU, memory, disk, and I/O utilization whereas Kibana is primarily used for analyzing log messages.
For more details, check the Grafana official documentation. Now, let’s learn how to install Grafana on Ubuntu/Debian.
Update the Ubuntu Repositories
Let’s update the repositories so we can download the latest package of Grafana from the official repositories. We’ll make use of the apt install command. If you’re still using apt-get install, check the difference between apt and apt-get command.
Let’s update and upgrade our system.
sudo apt update && apt upgrade
Steps to Install Grafana on Ubuntu/Debian
There are two ways to install Grafana on Ubuntu/Debian:
- downloading it through APT repositories
- downloading the .deb package/by downloading a binary .tar.gz file, then extracting it using tar command.
You can choose any of the two methods to install Grafana on Ubuntu, based on your comfort level.
1. Adding Grafana Source to Apt Sources
Let’s add the repository to the source list followed by adding the key for the repo file. We will use the add-apt-repository command to add the repo to the source list. Let’s have a look at the command below:
sudo add-apt-repository "deb https://packages.grafana.com/oss/deb stable main"
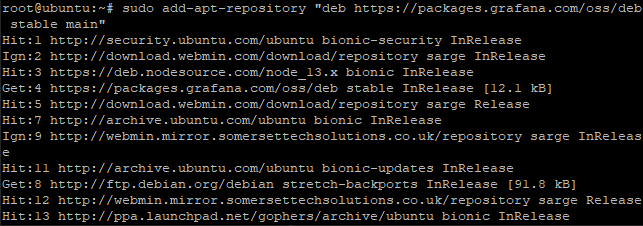
You might face the issue regarding the add-apt-repository command. If you face such, then use the echo command to download the repo and add it to the grafana.list file located in the /etc/apt/source.list.d directory. Let’s have a look at the command below:
echo "deb https://packages.grafana.com/oss/deb stable main" | sudo tee -a /etc/apt/sources.list.d/grafana.list
2. Import and Install Grafana Public Key
The next step is to add the key. We will use the wget command to add the key. It should respond with OK. Make sure you install the pre-requisite package “software-properties-common”.
Let’s have a look at the command below:
sudo apt install -y software-properties-common wget
wget -q -O - https://packages.grafana.com/gpg.key | sudo apt-key add -

3. Install Grafana on Ubuntu/Debian Linux
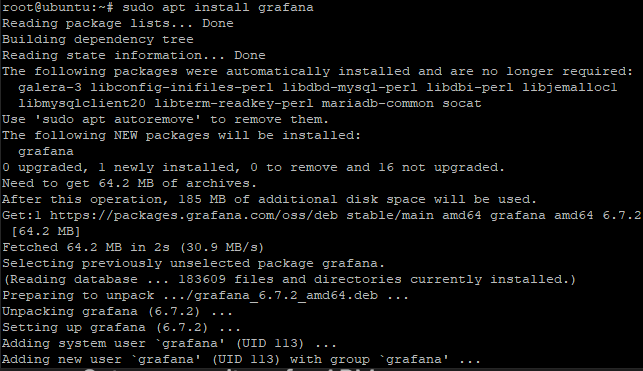
The next step is to install Grafana on Ubuntu/Debian Linux. The process completes in just three simple steps. Here, we will use the apt command to install the package. But before this, you need to update the packages once again to refresh the newly added repositories to our sources.list.
Let’s have a look at the command below:
sudo apt update
sudo apt install grafana
Hence, the installation process is completed but setup is still remaining.
Installing Grafana with .deb file
Earlier we discussed the method of installing the package using apt repositories. Here we’ll discuss how we can download and install Grafana on Ubuntu/Debian using the deb package.
Get the link of the latest version of the package, can check the downloads in the Grafana Official documentation.
You can use the deb package or the tar file. Either method works fine. Here I’ll download the .deb package since it’s much easier to work with on the Ubuntu system.
sudo apt-get install -y adduser libfontconfig1
wget https://dl.grafana.com/oss/release/grafana_6.7.2_amd64.deb
sudo dpkg -i grafana_6.7.2_amd64.deb
Let the process complete and you have successfully installed Grafana on Ubuntu! Let’s move on to starting the services and using Grafana.
Start Grafana Service
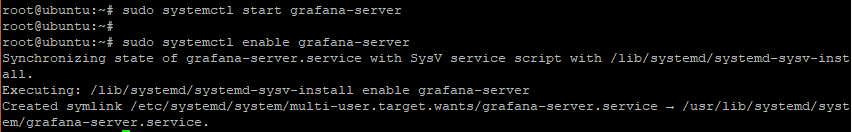
After you successfully install Grafana on Ubuntu, you need to start the service. We will use systemctl command with start keyword to start the Grafana service. Let’s have a look at command below:
sudo systemctl start grafana-server
sudo systemctl enable grafana-server
You can also check if the service has actively started running or not with the below command.
sudo systemctl status grafana-server.service
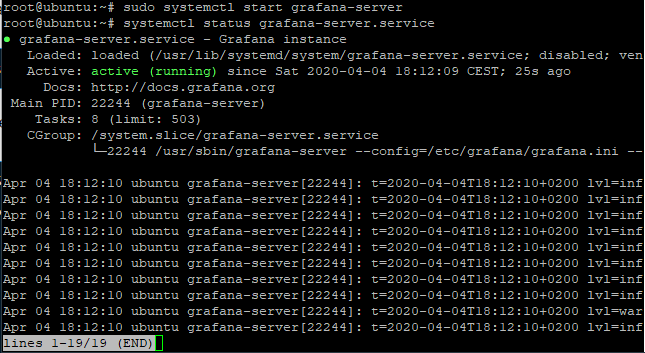
You can see the status as active highlighted in the image given above.
Set Firewall Configurations for Grafana
As we know that Grafana runs on default port 3000. Sometimes it happens that firewalls may block the access or the access of the port isn’t provided. Therefore, you need to provide access or to open the port.
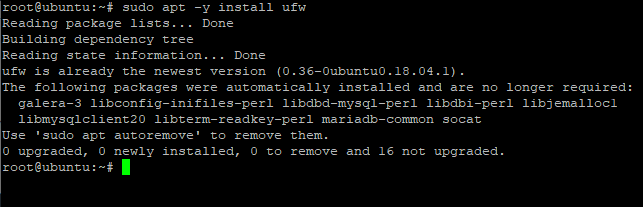
Ubuntu comes with the ufw firewall. For Debian, you need to install the ufw firewall. Let’s have a look at the command below:
sudo apt -y install ufw
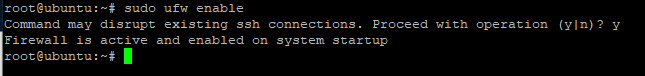
After installing the package, enable it and open the port on the firewall using the following command:
sudo ufw enable
sudo ufw allow ssh
sudo ufw allow 3000/tcp
You can also check whether the port is open or not using netstat command. Netstat command is used to display the list of all the running services in the system. Let’s have a look at the command below:
netstat -pnltu
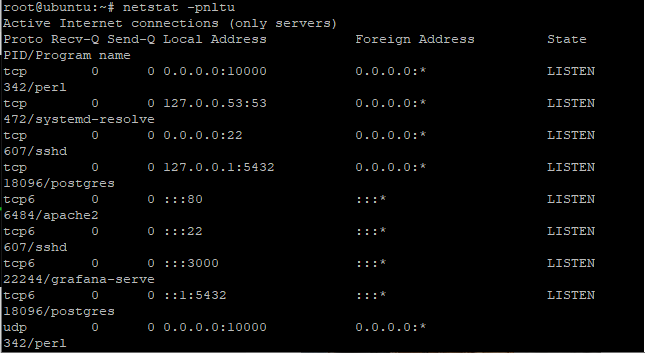
You can see the port 3000 is running. You have successfully opened the port on the firewall.
Grafana Basic Usage
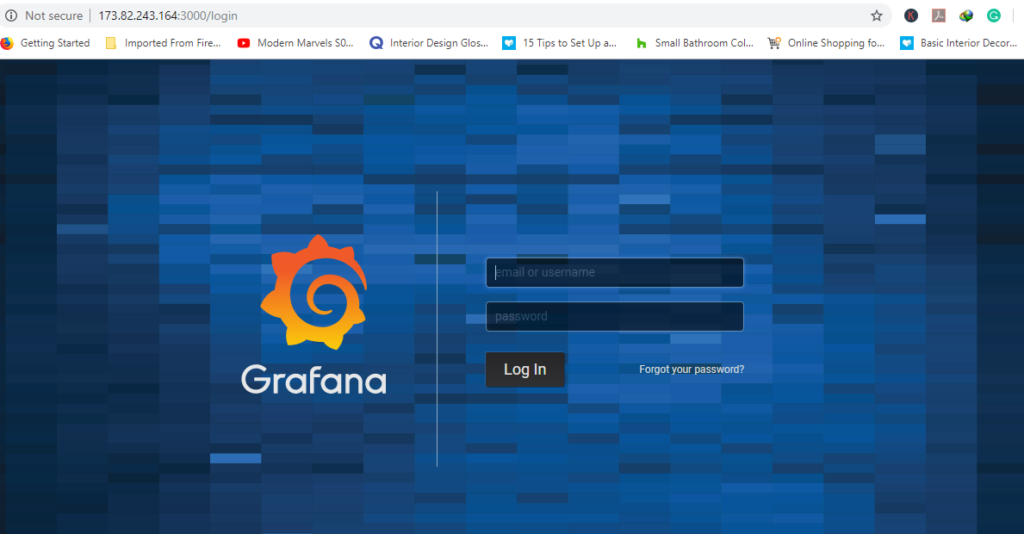
After we install Grafana on Ubuntu and finish the basic setup, we can fire up the browser and access our localhost. Let’s have a look at the command below:
http://server-IP:3000/
You would see the login dashboard where login with the credentials. The default credentials i.e the username and password is admin respectively. Both are same. Let’s have a look at the image below:
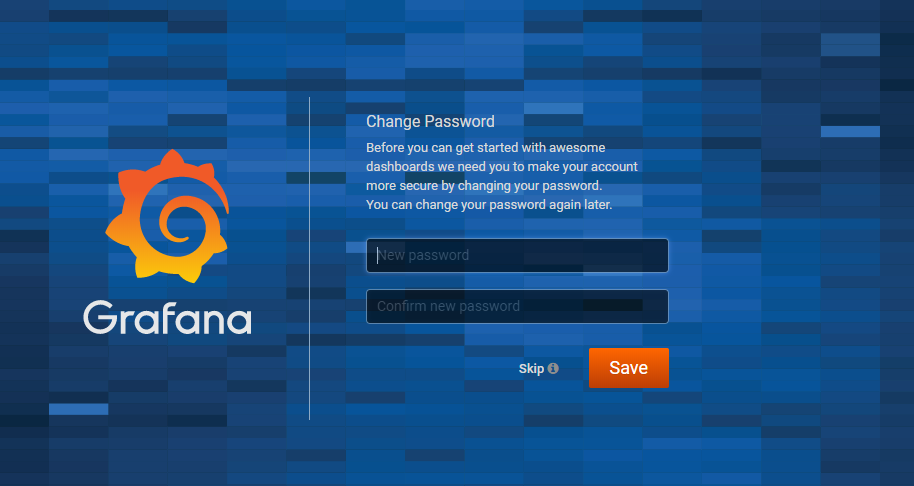
Further, you will be asked to set the secure password so that it won’t be accessed by anyone else. Therefore, set the password and process further to the Grafana dashboard.
Further, you will be directed to the Grafana dashboard as shown in the image below:
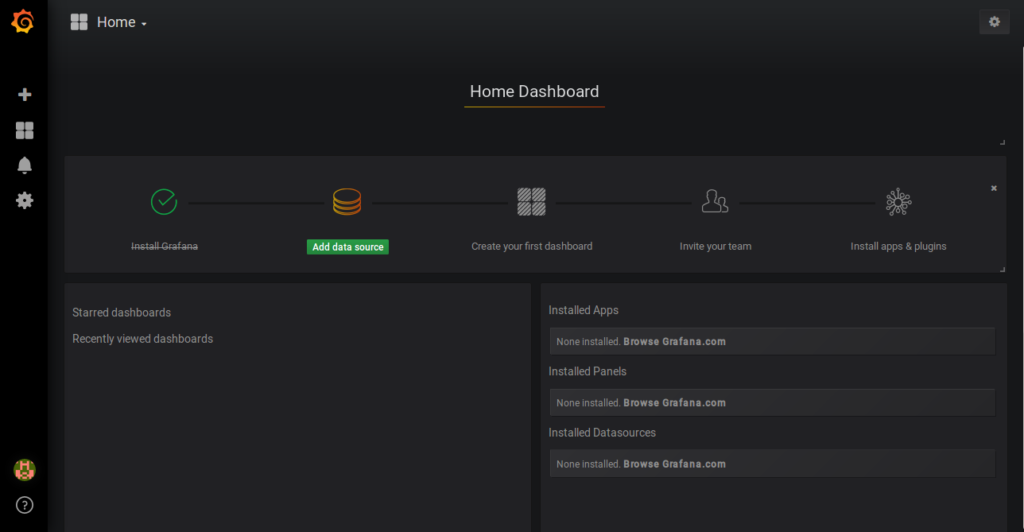
Now, you can perform the operations as per the choice. Yeah! we are done with the setup.
Conclusion
We have successfully learned how to install Grafana on Ubuntu/Debian. If you face any issues, than do let us know in comment section. Feel free to give the feedback.