
Monitoring is a critical part of Linux system administration. Whether you are running a desktop or a server, you need to know what is happening inside your machine—how much memory is being used, which processes are consuming CPU, and whether you are running out of disk space. Regular monitoring helps you troubleshoot problems early, optimize performance, and avoid unexpected downtime.
Linux offers several built-in tools for performance monitoring, and most of them work directly from the command line. In this guide, you will learn how to monitor your system’s CPU, memory, and disk usage using tools like top, htop, df, du, and free. These tools are simple, fast, and effective. You will also learn how to understand what the data means, so you can take action when needed.
Monitoring Linux Performance
Performance monitoring in Linux involves keeping track of system resources like CPU, memory, disk I/O, and network usage. While there are many advanced tools and dashboards available, command-line tools are the most reliable and are always available—even when your system is under stress.
Before jumping into specific tools, you should be familiar with some basic concepts:
- Load average indicates how many tasks are waiting to be processed.
- CPU usage shows how much processing power is in use.
- Memory usage tells you how much RAM is free, used, or cached.
- Disk usage reflects how much storage space is used or available.
- I/O wait shows how often the CPU is idle waiting for disk operations.
All of these metrics are useful for understanding if your system is performing normally or if it needs attention.
Using top and htop to View Real-Time Processes
The top command is one of the most commonly used tools for live performance monitoring. It displays a real-time view of your system’s running processes, CPU usage, memory usage, and more.
To start top, simply type:
top
You will see a list of processes, sorted by CPU usage. At the top of the screen, you can view system uptime, load averages, total number of tasks, CPU usage breakdown, and memory usage. The columns show details like process ID (PID), user, CPU and memory percentage, and command.
You can press q to quit the top command.
If you want a more readable and interactive alternative, use htop. It shows color-coded bars for CPU and memory, allows scrolling through processes, and supports filtering and sorting with keyboard shortcuts.
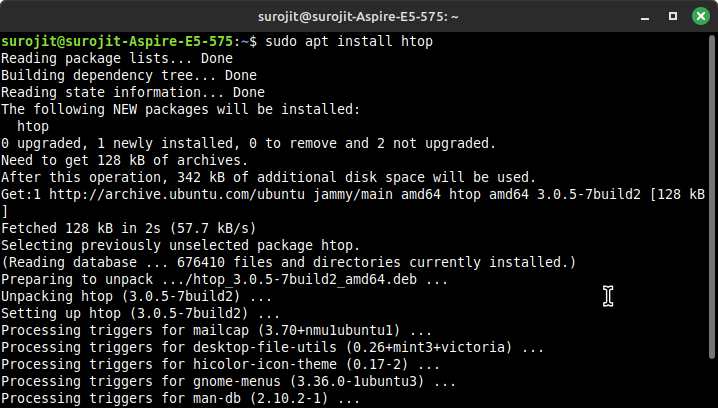
To install htop:
sudo apt install htop
Then run it:
htop
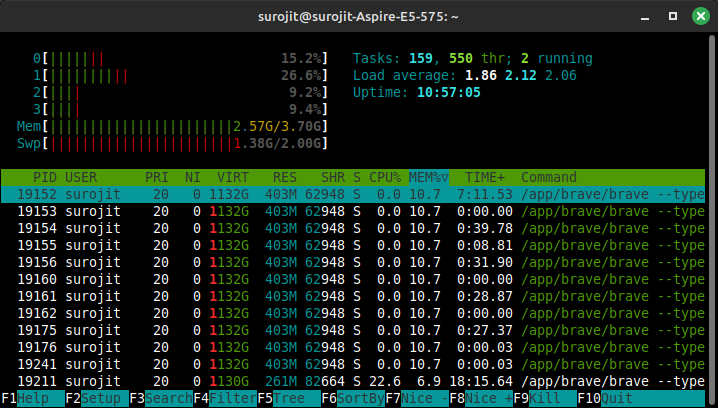
You can use arrow keys to scroll, F6 to sort columns, and F9 to kill a process directly from the interface. Press F10 to exit.
Both top and htop are useful for identifying processes that are consuming too many resources or behaving unusually. If your system is slow or overheating, these should be your first tools.
Checking Disk Usage with df and du
Disk space issues can cause major system problems. You may not be able to install updates, create new files, or even log in properly if your disk is full.
To check how much space is used on each mounted filesystem, use the df command:
df -h
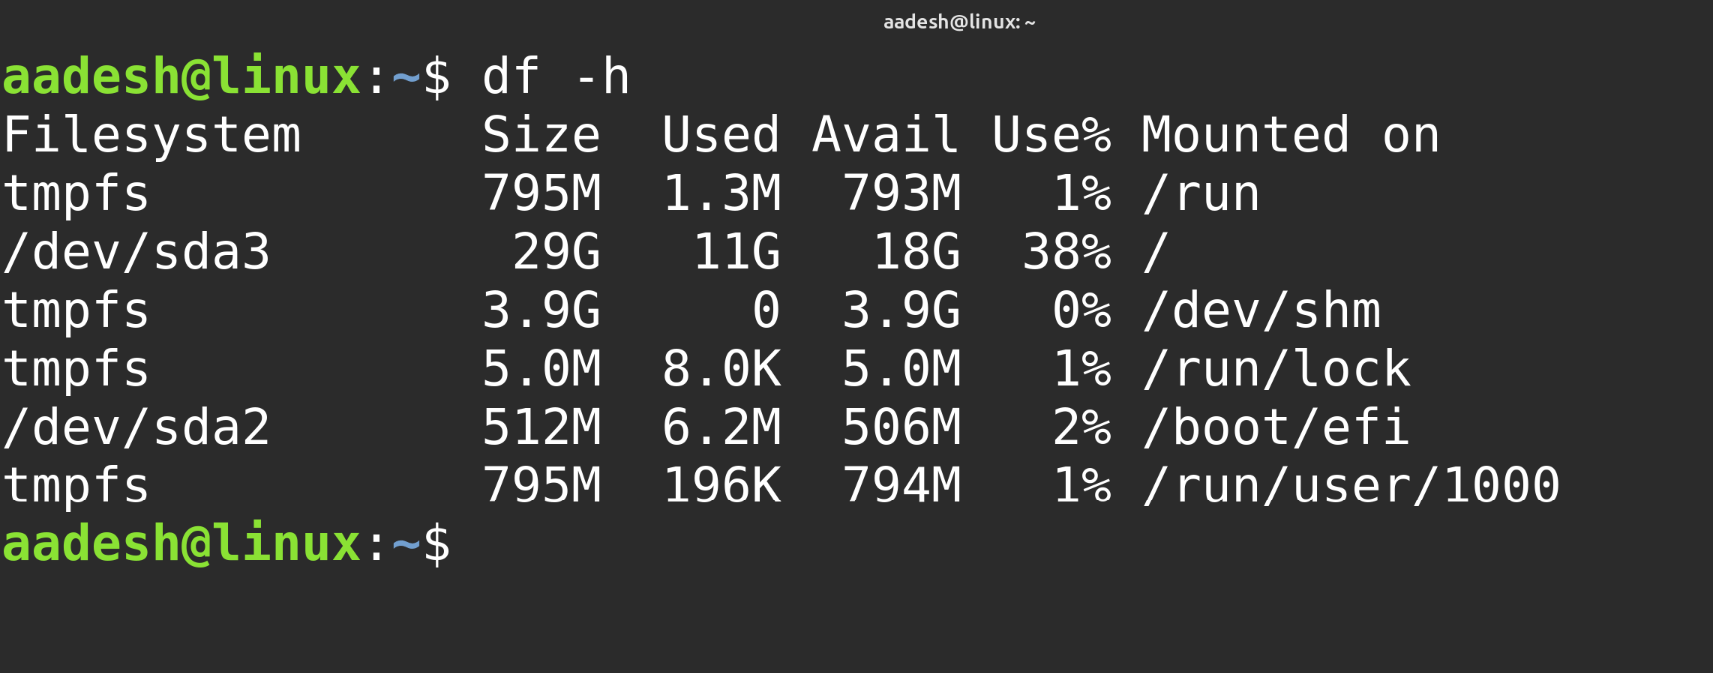
The -h flag shows output in human-readable format (e.g., MB and GB). You will see the total size, used space, available space, and mount points for each partition.
If you want to find out which directories or files are using the most space, use the du command. For example, to check the size of folders in your home directory:
du -sh ~/*
This will list each folder and its total size. The -s option summarizes each directory, and -h makes the output easier to read.
You can also check a specific directory:
du -sh /var/log
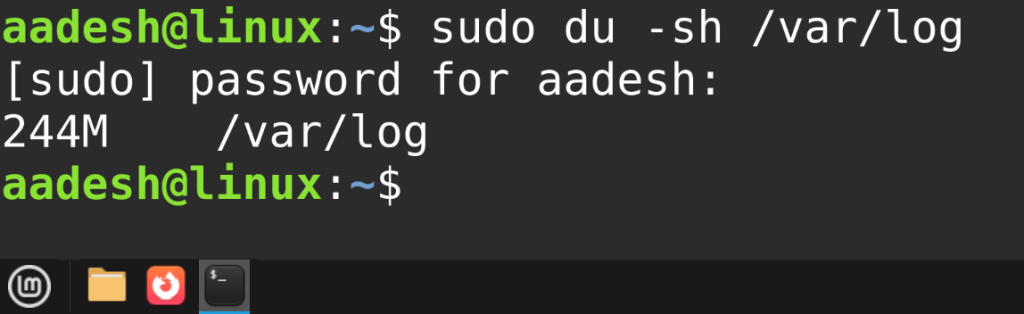
If you are running out of disk space and need to troubleshoot further, du helps you locate large files or logs that can be archived or deleted.
Checking Memory Usage with the free Command
To check how much memory is used and how much is available, the free command gives you a quick overview.
Run:
free -h
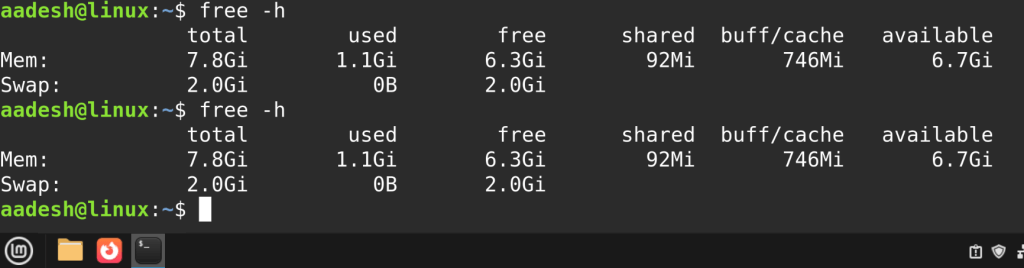
This shows total memory, used memory, free memory, and cached memory in human-readable units.
The output includes two types of memory, such as RAM, which is your system’s main memory and Swap, which is disk space used when RAM is full.
Understanding memory usage:
- Used includes what is currently in use by programs and services.
- Free is memory that is completely unused.
- Available is memory that can be quickly used without swapping, including free memory and some of the cache.
If you see that swap usage is high, your system may be running out of physical memory. You can check which processes are using the most memory using top or htop.
Summary
Monitoring Linux performance is a core skill for administrators and users alike. Tools like top and htop show you real-time CPU and memory usage, making it easier to identify resource-heavy processes. Disk tools like df and du help you understand how storage is used across your system, so you can avoid running out of space. The free command gives you a quick view of your RAM and swap usage, which helps in diagnosing slowdowns caused by low memory.
These tools are built into most Linux systems or can be installed quickly. They are reliable, lightweight, and do not require a graphical interface. By using them regularly, you can detect problems early, keep your system running smoothly, and respond quickly to performance issues. In the next article, we will explore Virtualization in Linux: Using Docker and Podman.