

The vmstat command is short for ‘Virtual Memory Statistics’. It is a tool that reports on Virtual memory statistics. To be specific, it reports data about your system’s memory, swaps, and processor resource utilization, kernel threads, and disks in real-time. Linux developers often use this tool to solve issues related to memory.
Running the vmstat command without any options gives the summary of memory statistics since the last re-boot of the system. Alternatively, you can use vmstat to report on memory periodically after a fixed interval also. We will look at this and lots more in this tutorial.
Using vmstat command
Firstly we will look at the output when vmstat command is run without any option. For this you have to type vmstat and hit enter.
vmstat

I know that’s a lot of parameters. Let’s look at what each of them means :
- Procs
- r: number of active processes.
- b: number of processes in uninterruptible sleep.
- Memory
- swpd: the amount of virtual memory used by the system.
- free: the amount of idle memory also known as free memory.
- buff: the amount of memory used as buffers.
- cache: the amount of memory used as cache.
- Swap
- si: memory swapped in from disk. The value represents the rate of swap (per second). (In)
- so: memory swapped to disk. The value represents the rate of swap (per second). (out)
- IO
- bi: Rate at which blocks received from a block device (blocks/s).
- bo: Rate at which blocks sent to a block device (blocks/s).
- System
- in: number of interrupts per second, including the clock.
- cs: number of context switches per second done by the scheduler.
- CPU – These are percentages of total CPU time.
- us: percentage of CPU time spent on user processes.
- sy: percentage of CPU time spent on kernel processes.
- id: Percentage of time spent idle.
- wa: Percentage of CPU time spent waiting for I/O.
- st: Percentage of time stolen by a virtual machine.
1. vmstat Command With Interval and Iterations
To get the output in realtime you can specify an interval along with vmstat. The way to do this as follows :
$ vmstat [DELAY] [ITERATIONS]
- ‘Delay‘ represents the amount of time before the output is refreshed.
- ‘Iterations‘ represent the number of times the output is to be refreshed.
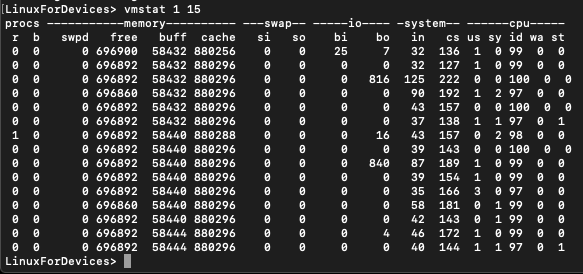
By default, if only delay is mentioned then the process goes on until the user terminates it. To terminate it the user needs to press Ctrl + C. To have a delay of 1 second and have that repeated over 15 iterations the command will look like :
$ vmstat 1 15
If we don’t mention the iteration value then the output will look like :
$ vmstat 3
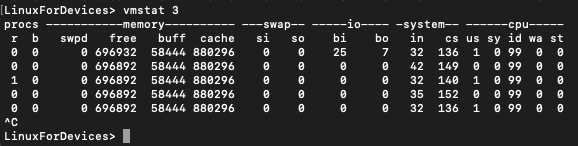
Here the output is refreshed every 3 seconds. To terminate press Ctrl + C. Often it is useful to store this information in a file. You can do that using:
$ vmstat 1 5 > vmstat.txt

2. Identifying the Number of Forks with vmstat
In Linux operating system, fork is basically a system call to create a child process from a running parent process.
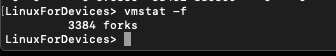
You can use -f flag along with vmstat command to display the total number of forks since system reboot. The total number of forks is the sum of fork, vfork, and clone system calls.
$ vmstat -f
3. Event counters and memory statistics
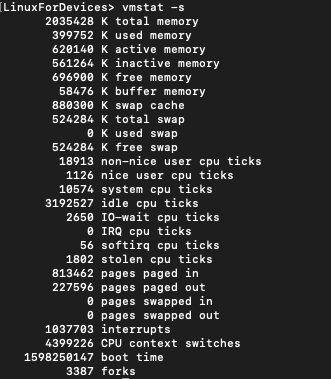
To display additional information about memory, use the -s flag along with vmstat command. This command displays a table of various event counters and memory statistics.
$ vmstat -s
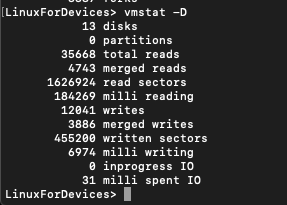
4. Disk Statistics
Like memory statistics above, you can also get information about your disk activity using the -D flag.
$ vmstat -D
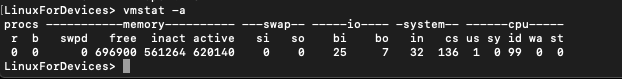
5. Active and Inactive memory
To display active and inactive memory in place of buffer and cache use the -a flag along with vmstat command.
- Active memory refers to the pages that were recently accessed.
- Inactive memory refers to the pages that were not accessed recently.
$ vmstat -a
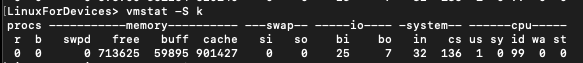
6. Change the units
You can change the unit of memory in the output. To do so use the -S flag along with vmstat command. The -S flag is followed by one of the four:
- k – Kilobyte(1000 bytes)
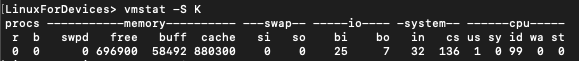
- K – Kibibyte (1024 bytes)
- m – Megabyte (1000000 bytes)
- M – Mebibyte(1048576 bytes)
The syntax is as follows:
$ vmstat -S [option]
Here you can replace option with any of the 4 listed above.
$ vmstat -S k
$ vmstat -S K
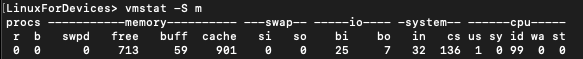
$ vmstat -S m
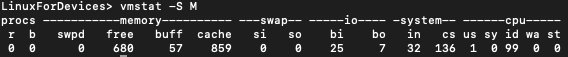
$ vmstat -S M
Conclusion
In this tutorial we covered vmstat which is popular tool for tracking system performance. To learn more about vmstat command, look at its man page.