

The iostat command in Linux lets you monitor CPU utilization and I/O (input /output) statistics of all the disks and file systems. Iostat reports are useful for changing system configuration to better balance the input/output load between physical disks. This command is a must-know for Linux system administrators. In this tutorial, we will be learning about the iostat command and exploring the different options available along with it.
Let’s get started
Using iostat command to generate report and statistics
To generate reports and statistics with the iostat command use :
iostat
Output :
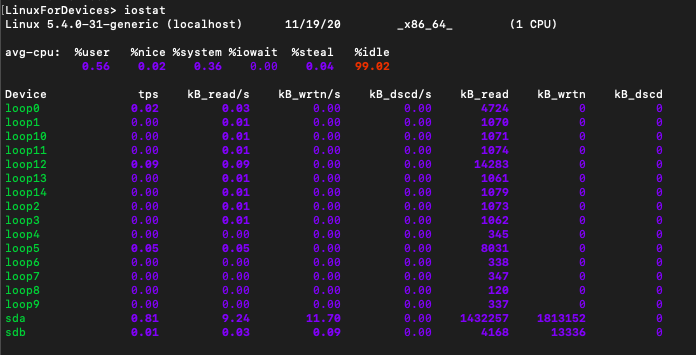
In the output there are two types of reports. The first one is the CPU utilization report. The second one is the Device utilization report.
Let’s try and understand the different fields in the output.
1. CPU Utilization Report
The CPU Utilization report has the following fields :
- %user : Displays the percentage of CPU utilization that occurred while executing at the user level.
- %nice : Displays the percentage of CPU utilization that occurred while executing at the user level with a nice priority.
- %system : Displays the percentage of CPU utilization that occurred while executing at the system (kernel) level.
- %iowait : Displays the percentage of the time that the CPU(s) was(were) idle during which the system had an outstanding disk I/O request.
- %steal : Displays the percentage of time being spent in involuntary wait by the virtual CPU(s) while the hypervisor was servicing another virtual processor.
- %idle : Displays the percentage of time that the CPU(s) were idle and the system did not have an outstanding disk I/O request.
2. Device Utilization Report
The Device Utilization report has the following fields :
- Device : Displays the device/partition name as listed in /dev directory.
- tps : Displays the number of transfers per second that were issued to the device. A transfer is an I/O request to the device.
- Blk_read/s : Displays the amount of data read from the device expressed in a number of blocks (kilobytes, megabytes) per second. This is the rate at which data is being read.
- Blk_wrtn/s : Amount of data written to the device expressed in a number of blocks (kilobytes, megabytes) per second. This is the rate at which data is being written.
- Blk_dscd/s : Data discarded for the device expressed in a number of blocks (kilobytes, megabytes) per second. This is the rate at which data is being discarded.
- Blk_read : Total number of blocks read.
- Blk_wrtn : Total number of blocks written.
- Blk_dscd : Displays the total number of blocks discarded.
You can also generate the two reports individually. Let’s learn how to do that.
Display only the CPU utilization report
To display only the CPU utilization report use the -c flag along with iostat. Syntax:
iostat -c
Output :
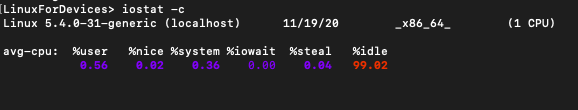
Display only the device utilization report
To display only the Device utilization report use the -d flag along with iostat. Syntax:
iostat -d
Output:
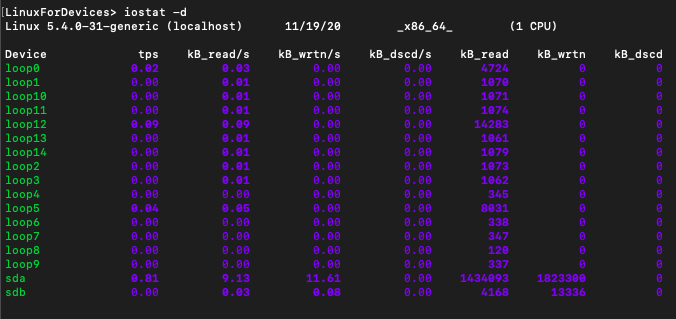
Get the output in a human readable format
If you use the -h flag along with iostat command, it displays the output in a human readable format.
iostat -h
Output :
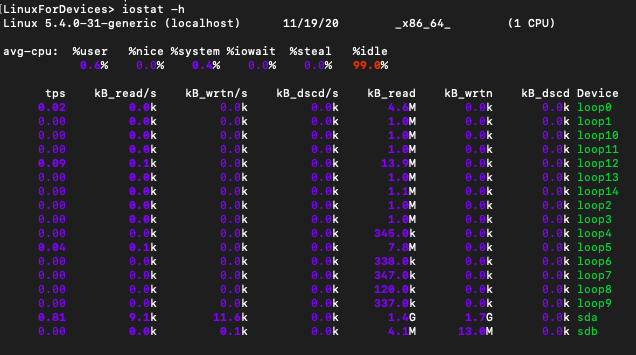
All the values now have units along with them.
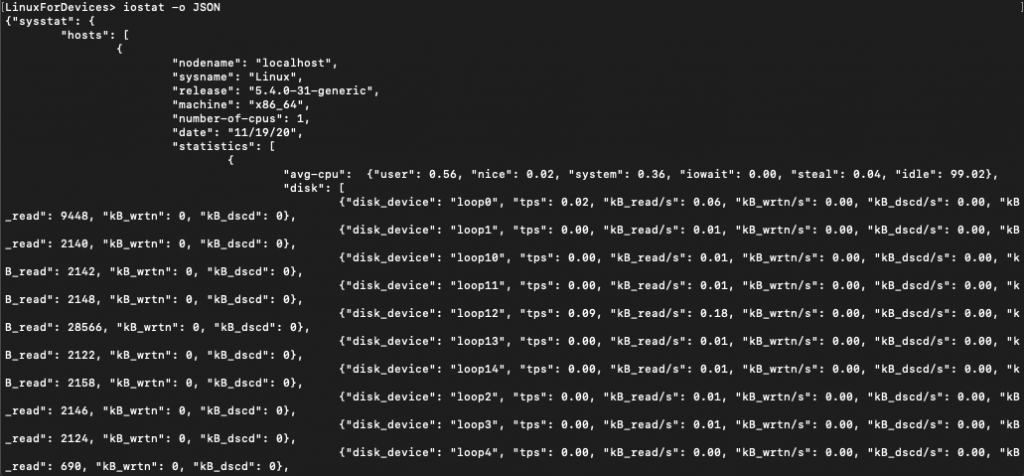
Generate report in JSON format
JSON is short for JavaScript Object Notation. It is an open standard file format, and data interchange format, that uses human-readable text to store and transmit data objects consisting of attribute–value pairs and array data types. It is a popular format for sending and receiving data. If you want to send your report to someone, then it is advisable to use the JSON format.
To get the report in JSON format, use:
iostat -o JSON
Output:
Display iostat statistics with different units
You can customize the units in your iostat reports. We will look at two options available along with the iostat command. These are :
- -k : Display statistics in kilobytes per second
- -m : Display statistics in megabytes per second
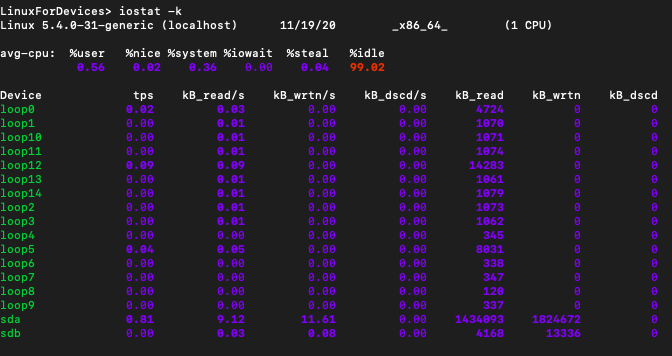
Display statistics in kilobytes per second
To display statistics in kilobytes per second use the -k flag along with iostat command.
iostat -k
Output :
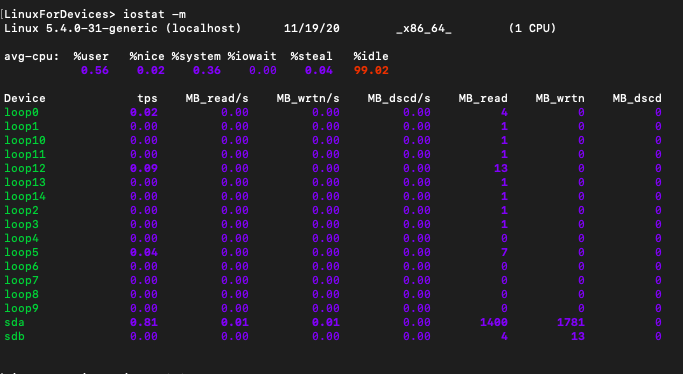
Display statistics in megabytes per second
To display statistics in megabytes per second use the -m flag along with iostat command.
iostat -m
Output :
FAQ’s
What is the iostat command in Linux used for?
The iostat command in Linux is used to monitor and generate CPU and device utilization reports.
How can I use the iostat command to monitor server performance?
You can use the iostat command to monitor server performance by analyzing CPU activity, virtual memory statistics, and disk activity.
What is vmstat and how does it relate to the iostat command in Linux?
Vmstat is a command-line utility that reports virtual memory statistics. It can be used in conjunction with the iostat command to provide comprehensive performance monitoring on a server.
Can I specify the time interval for generating iostat reports?
Yes, you can specify the time interval for generating iostat reports to monitor system performance over a specific period, such as every 5 seconds or 1 minute.
What information does the iostat command display about CPU usage?
The iostat command displays CPU statistics including the percentage of time the CPU or CPUs were idle, system, user, and nice processes, as well as overall CPU usage.
What does the iostat command show in terms of disk activity?
The iostat command displays information about disk activity including average transfer rates, block I/O, and utilization of different disk devices.
Conclusion
This tutorial was about iostat command in Linux. We learned how to generate CPU and Device utilization reports using this command. To learn more about the isostat command refer to its man page online or use the man command.