

htop is a Linux utility for displaying crucial information about the system’s processes. It can be considered as a Linux counterpart of Windows Task Manager. Using htop feels more like an interactive program, as it supports mouse and keyboard operations for switching between values and tabs. In this tutorial, we will learn how to install and use Htop in order to monitor system processes of our system.
Installing Htop
First of all, this command is not always installed on all the distributions (they usually ship the top command), so depending upon which distro you are using, you can run the following command:
# On Debian and Ubuntu based systems:
sudo apt update && sudo apt install htop

# On Fedora workstation:
sudo yum install htop

# On Arch Linux and its derivatives:
sudo pacman - S htop
After the tool is installed, let’s look at the workings of this utility.
Introduction
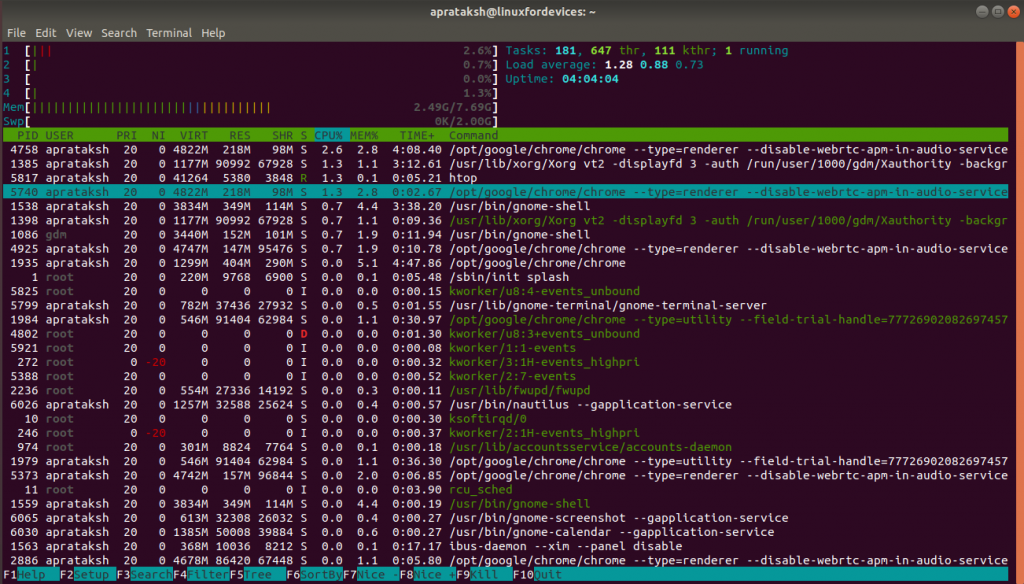
To make use of this awesome Linux feature, we type 'htop' in the terminal. After running the command, the terminal is transformed into a colorful representation of data. It looks just like this:
Note: It may happen that
htoputility might not be installed on your system. Debian and Ubuntu users can easily install it by'sudo apt-get install htop'. Other Linux users, can follow their respective standard methods to installhtop.
The program features huge amount of data that can overwhelm any user at first. We will go through all aspects of htop one by one.
CPU and Memory Usage
The top-left panel in the system monitoring tool, corresponds to CPU and Memory usage.

The count 1-4, represents the cores/CPUs of the system. The bar describes the amount and type of processes using each core. The value against the bar denotes the percentage each core is being consumed.
Color coding for CPU
As it is quite visible to the user, there are a multiple colours used to describe the bar. Each colour has a specific meaning:
- Green – Amount of CPU consumed by the user’s processes.
- Red – Amount of CPU used by system processes.
- Grey – Amount of CPU used for Input/Output based processes.
Note: There are few other color codes that are not explained here due to less importance. To learn about them, run
'man htop'in the terminal for accessing the manual pages.
The panel also contains information related to the amount of memory being used at every instant. The ‘mem’ bar represents the main memory (or RAM), whereas ‘swp’ refers to the swap memory.
Color coding for Memory
- Green – Percentage of RAM being used for running processes in the system.
- Blue – Percentage of RAM being consumed by buffer pages.
- Orange – Percentage of RAM being used for cache memory.
Task statistics
The right-hand side part of the screen shows the task statistics:
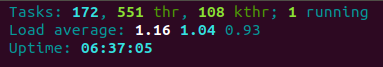
It displays the following information:
- The first entity ‘172’ represents the number of current tasks/processes in the system.
- These 172 processes are handled by ‘551’ number of threads (thr).
- Of these 551 threads, there are ‘108’ kernel threads (kthr).
- Among 172 tasks, only a single task is in the state of running.
- Load Average – Since this is a quad-core system, the maximum amount of load is 4.0. The values mentioned are moving averages over different periods of time.
- ‘1.16’ – Average load for the last minute.
- ‘1.04’ – Average load for the last 5 minutes.
- ‘0.93’ – Average load for the last 15 minutes.
- Uptime – Amount of time since the last system reboot.
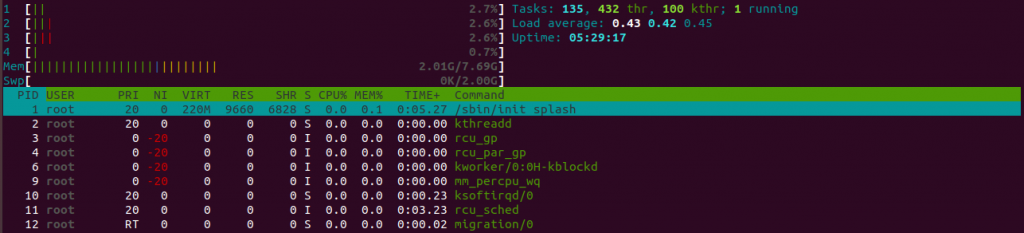
Process Information
The main part of the htop command is the vast amount of information it provides for each process in the system.
Each process title comprises of the following default information:
- PID (Process ID) – Unique number designated to the process.
- USER – The owner of the process.
- PRI (Priority) – The kernel’s priority for the process.
- NI (Nice Value) – The process priority as viewed by the USER. (Higher nice value – Lower priority).
- VIRT (Virtual Memory) – The amount of virtual memory the process is consuming.
- RES (Resident Memory) – The proportion of RAM the process is using.
- SHR (Shared Memory) – The amount of shared memory the task is occupying.
- S (Status) – The current state of the process, S – Sleeping, R – Running, etc.
- CPU% – The percentage of CPU used by the process.
- MEM% – The percentage of Memory consumed by the process.
- TIME+ – The period of time since the process initiated.
- Command – The complete command for the process with program name and arguments
These are the standard columns for the htop. There are more process-related attributes. We will see later in the article for steps to change the columns.
Interactive Options
At the bottom of the screen, we can see some options are displayed. These options come in handy in various situations.

We can either press the key mentioned before the option or just click on it.
F1 – Help
Any program in a system needs a help tab for beginners to get a grasp on it. Pressing 'F1' will switch the screen from showing processes to this:
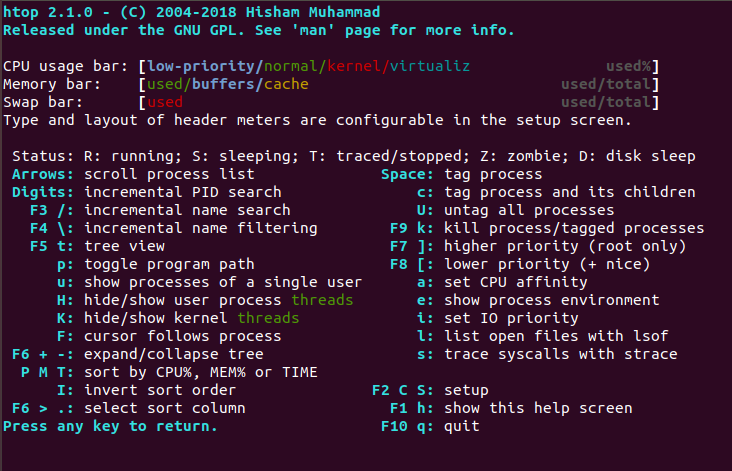
By going through this screen, we can understand some of the basic operations in htop.
F2 – Setup
The setup option is one of the most detailed aspects of this utility. This option allows us to customize the htop screen ourselves.
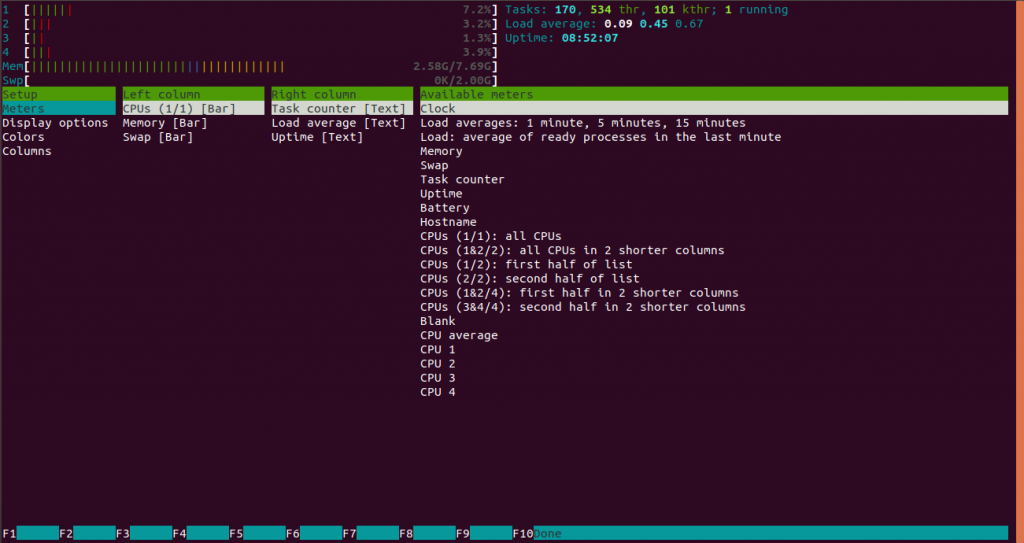
htop allows us to customize the following things:
- Meters – The top part of the screen containing CPU Usage and Task statistics.
- Display Options – The way in which the process information is being shown.
- Colors – The coloring scheme of the program.
- Columns – Remove or add columns related to the processes.
Let us see an example to customise our htop console.
Setup example
Our aim to is add the information related to battery between Load Average and Uptime row. This can be done by:
Step 1: Press the F2 Key and To Edit Meters
To reach the option, we use the arrow keys to traverse through the tables. After pressing the right arrow key thrice and down arrow key seven times, we will reach the desired position. Keeping in mind, that the blue highlighter denotes our current selection.
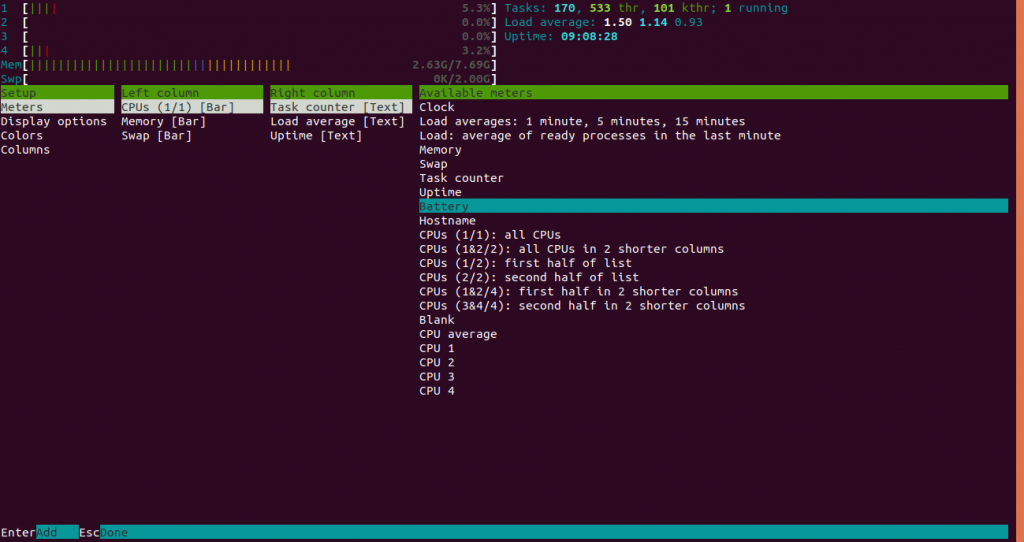
Step 2: Lock the selected option
Needless to say, the options at the bottom of the screen denote the keys that are required to achieve our task. We can select the option either by pressing 'ENTER' key or clicking on it using the mouse. On selecting, we can traverse inside the console in an attempt to select the desired position.
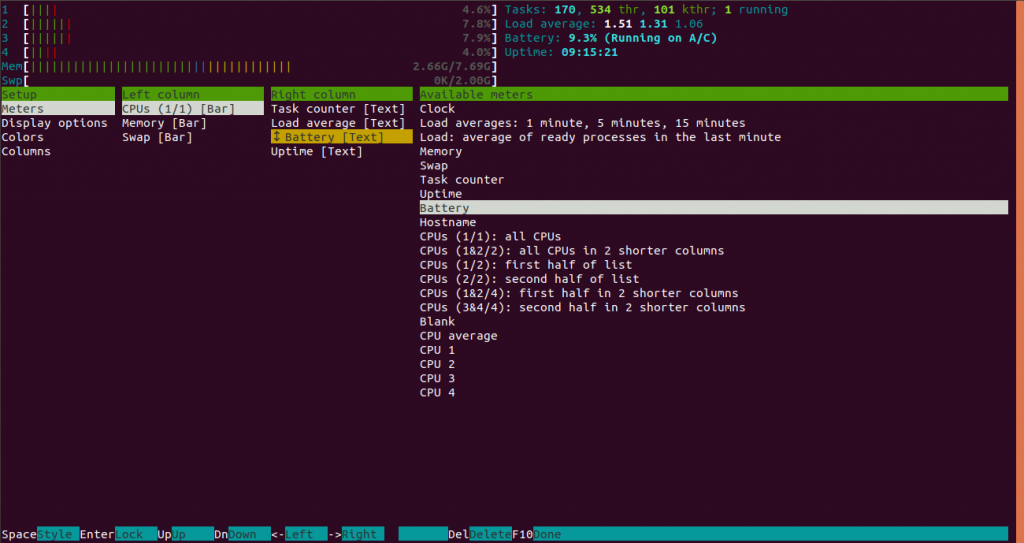
Step 3: Add the meter to the htop command screen
After positioning the option, we can successfully place it using the 'ENTER' key. After doing so, and pressing 'F10', we can exit the setup tool.
Note: In case, the keyboard shortcuts are confusing, we can always using the mouse to navigate in the program.
F3 – Search for a Process
This tool allows us to search through the processes running on the system. For instance, if we need to find the process running htop command itself, we can use the F3 key, and type in “htop” as shown below.
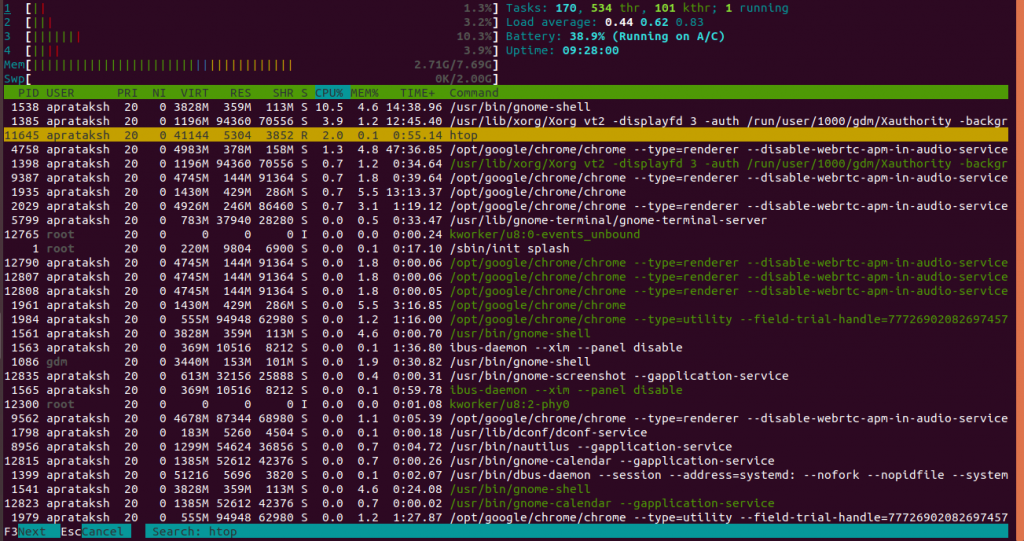
Using the key 'F3' again, we can move on to the next occurrence of the word searched.
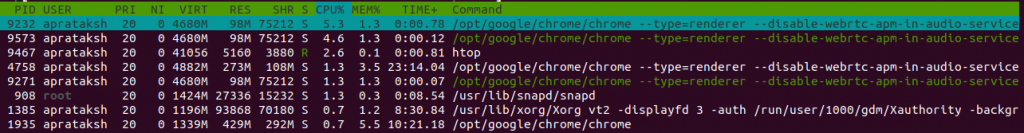
F4 – Filter through the processes
Instead of searching for keywords among numerous processes in the process list, it might be easier in some cases to only display those processes matching the keyword. For this, the filter option comes into play. Press the F4 key, and enter the word that you want to filter the processes with.
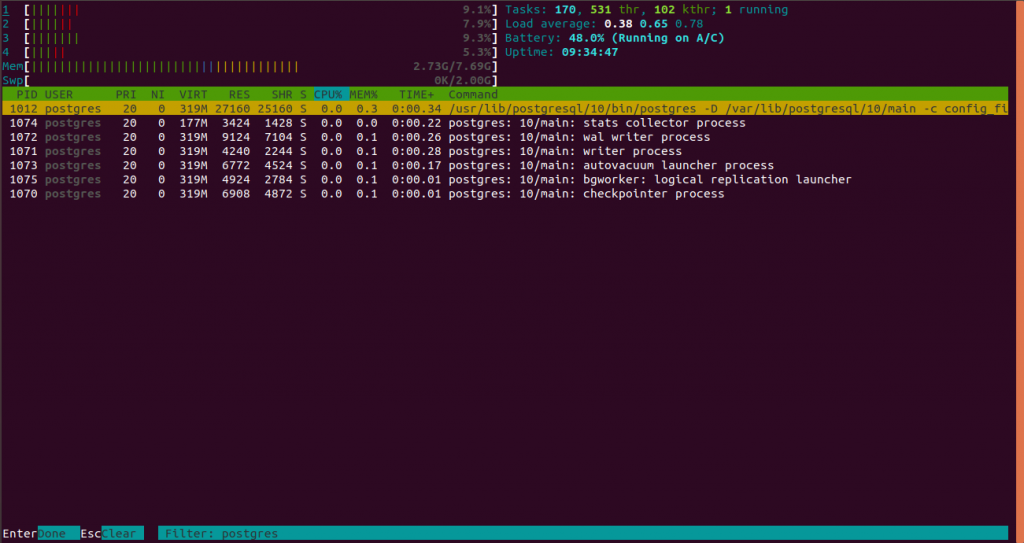
In the above example, only those processes are listed that has ‘postgres’ keyword in their command section.
F6 – Sort By
htop command allows us to sort the processes according to any particular column. Pressing the 'F6' key, takes us to the sorting screen, which looks like this:
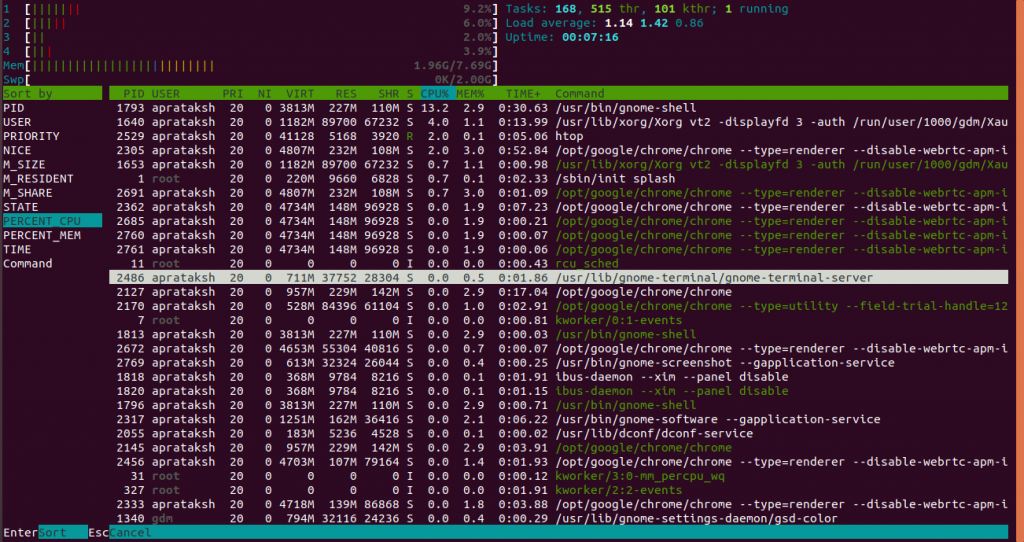
By default, the processes are sorted on the basis of CPU%. Using the arrow keys, we can select other parameters for sorting.
Note: Rather than switching to “sort by” screen, we can sort processes, by clicking on the header of each column. Clicking it again leads to the sorting of elements in reverse order.
F9 – Kill a process using the htop command
htop command allows us to monitor as well as kill any process. Selecting a process, and pressing the F9 key, leads to killing the process. Linux handles the killing of tasks automatically when the command or process exits. Unless you need to, there won’t be any need to manually kill tasks.
F10 – Quit htop
Pressing the F10 key will quit the htop screen. You can also just exit out by closing the terminal.
Some extra options
Other than the options present in the footer, htop presents more options that can be accessed using keyboard shortcuts:
- User-based filtering – Pressing the key
'u'on the main screen, opens a sidebar using which we can filter processes on the basis of users. - Open process-related files – Pressing the key
'l', the program window switches to displaying the files related to the selected process. - Display kernel threads – To display the kernel threads using
'htop', we need to enter'K'. - Display user threads – User threads can be displayed using
'H'key. - Refresh – For refreshing the information related to processes, we need to hold
'Ctrl + L'key.
Note: The reader must be aware that,
'K'and'k'are different for'htop'command. Lowercase'k'leads to the kill screen. Therefore if you need to access kernel threads, you must hold the'SHIFT'key or use the'CAPS LOCK'key.
Command Line options
The htop command supports multiple options that can be added to it, in the Linux terminal.
1. Delay
The htop console changes swiftly, as the processes do not wait for the user. htop provides a feature in which the process details are updated after a certain delay. It can be done by using the following:
htop -d 10
The argument to be entered must in tenths of a second. (Above command issues a one-second delay).
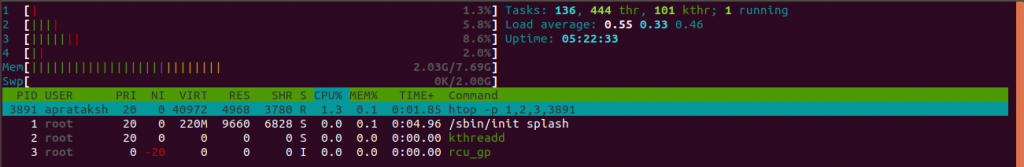
2. Filter with PID
Using the information of process IDs, we can monitor only those processes having specific IDs.
htop -p 1,2,3,3891
3. COLUMN-based sort
Using the knowledge of COLUMN Names, we can sort it from the htop line itself by:
htop -s PID
To learn more about the columns and their uses, one can refer to the manual pages, using 'man htop'.
Conclusion
Similar to the Windows Task Manager, the htop command is a very powerful Linux utility. It allows us to monitor, troubleshoot, and kill processes running in our Linux systems. We hope this article is above your expectations. Feel free to share your thoughts below.
Also Read
Waydroid – Run Android natively on Linux
Whats’s new in Linux Mint 21.3?