

Checking the amount of memory that is being used is something every user does when the system runs slow. It is even more important for system administrators who have to keep a tab on the system resources that are being utilized by the servers or machines that they are handling.
You may be aware of one or two ways to check, in this article we are going to discuss and go in detail on various ways you can check your Ubuntu machine’s memory usage.
Memory, also known as random access memory (RAM), is a type of computer data storage that stores instructions and data that can be directly accessed by the computer’s CPU. A memory module contains a number of memory chips on a small circuit board. When you buy additional RAM for your PC, you add additional modules to the existing slots.
Also read: Memory Management in Linux – How to Manage Linux Memory
When it comes to checking the memory usage of Ubuntu we are offered two ways to go about this,
- Using a GUI
- Using Terminal
Method 1: Using Ubuntu System Monitor
The beauty of Ubuntu is that it has a very approachable graphical user interface to easily check all of the system resources usage using a system monitor.
System Monitor in addition to the memory usage also displays other details of the system like the CPU utilization, network utilization, processes that are running currently, and disk storage.
Here are step-by-step instructions on how to check memory utilization using “System Monitor”
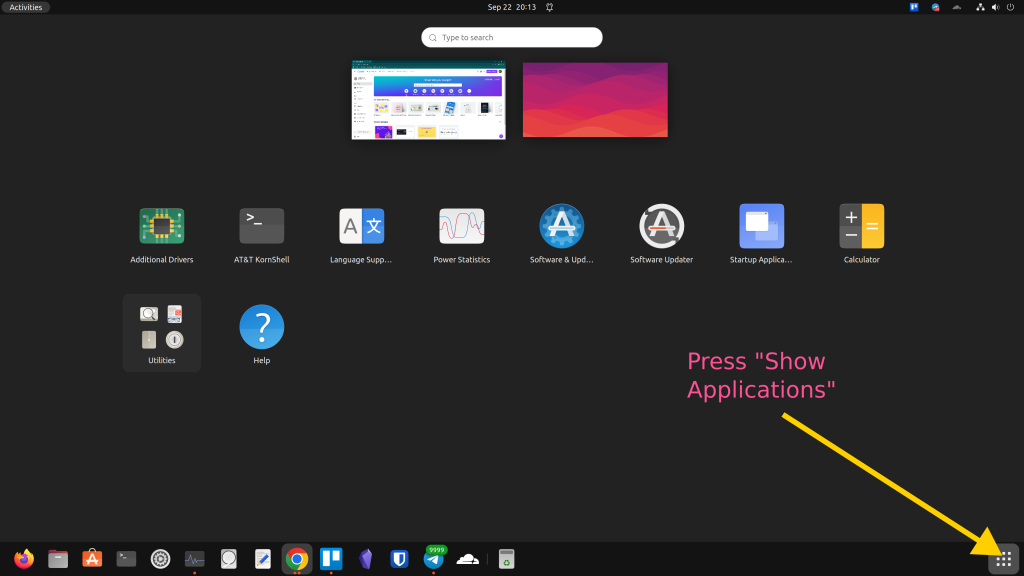
Step 1. In Ubuntu, Press the “Show Applications” button in the Taskbar
Step 2. Search for the “System Monitor”
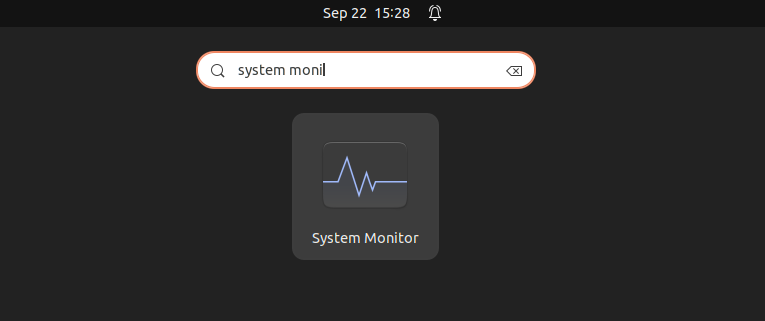
Step 3. Click in the System Monitor
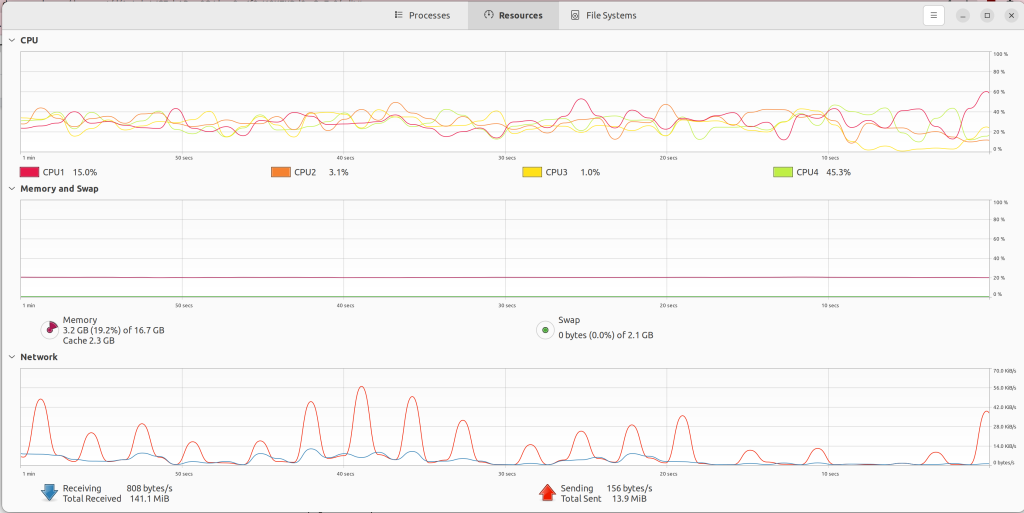
Step 4. Click on the “Resources” tab.
Under the “Memory” section, you will see the total amount of available memory, as well as the amount of used and free memory.
Now that we have learnt how to use the GUI to check the memory, we will start using TUI from here on. Terminal offers more than one way to check memory usage, making the terminal very versatile for computer administration.
Method 2: Using htop
The htop command is a Linux performance monitoring tool that shows real-time information about the CPU and memory usage.
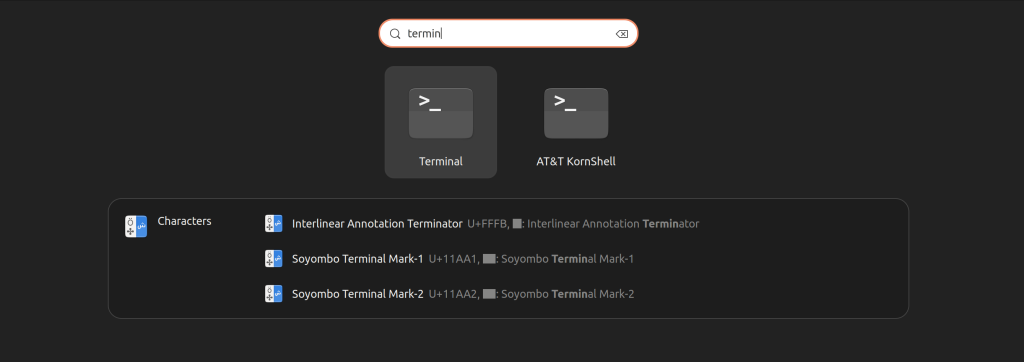
Step 1. Press the show applications button, and search for the terminal.
Step 2. Install htop. To install “htop”, open a terminal and type:
sudo apt install htop
Step 3. Once “htop” is installed, open a terminal and type: htop
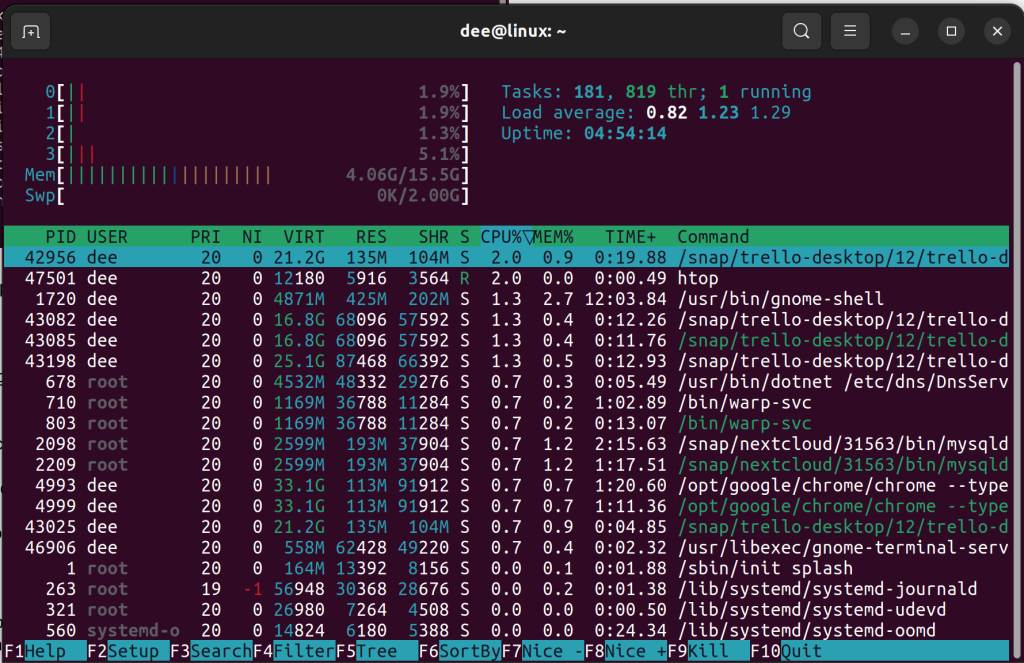
Htop displays a real-time updated list of processes that presently running which is ordered by the CPU usage that is being consumed by each of the processes.
In addition to displaying the overall memory utilization, htop also displays CPU utilization by each core, the swap space, the number of tasks that are running currently, and load average by the tasks that are running in the 1-minute, 5 minute and 15-minute time period, and the total uptime of the machine.
There are even more details that are displayed in the processes area details such as PID, USER group the processes belong to, Process priority, Process niceness, and Memory usage by processes that can be further divided into:
- VIRT(virtual Image)
- RES(Resident Size)
- SHR(Shared Memory Size)
- S which is for displaying the process state
- CPU usage by each process in percentage
- overall memory usage by each task in percentage
- time each task or process has been running for
- and finally, the command that is being executed
Method 3: Using the “cat” /proc/meminfo Command
This method again relies on the terminal to display the memory usage. The /proc/meminfo file provides detailed information about memory usage on the Linux system. Each line in the file represents a different aspect of memory usage. The first few lines provide summary information about memory usage, while the remaining lines provide more detailed information about specific areas of memory.
- To view the “/proc/meminfo” file, open a terminal and type:
- cat /proc/meminfo
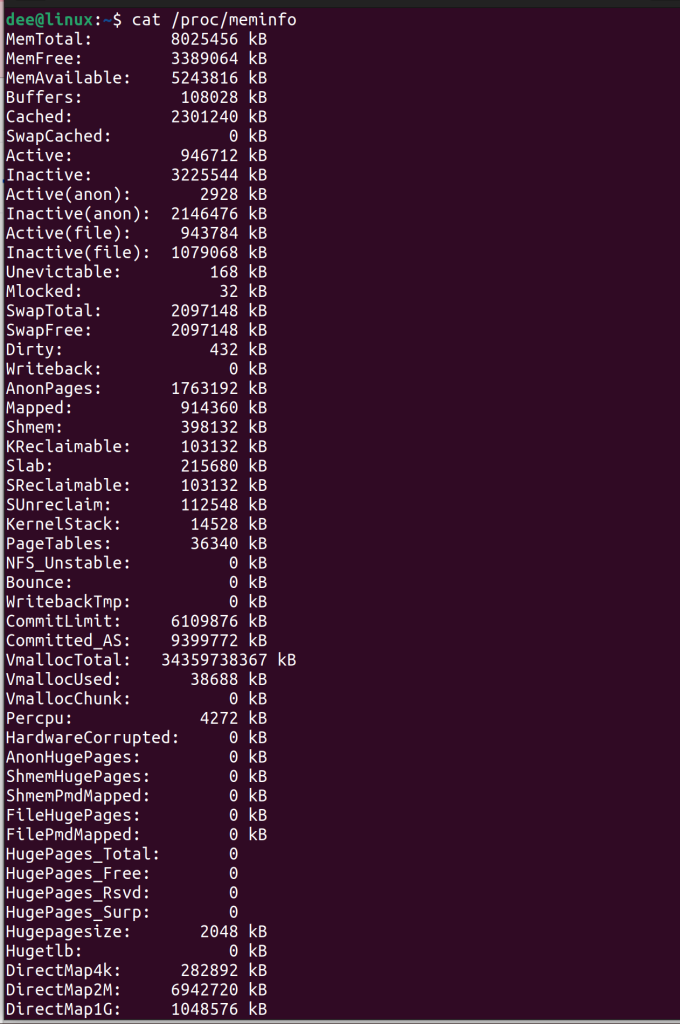
Here is a breakdown of some of the information provided in each line of /proc/meminfo:
- MemTotal: This is the total amount of physical memory on the system.
- MemFree: This is the amount of physical memory that is not being used by the system.
- Buffers: This is the amount of memory being used by buffers. Buffers are used by the kernel to store data that is being read from or written to disk.
- Cached: This is the amount of memory being used by the page cache. The page cache is used by the kernel to store recently accessed data in memory so that it can be quickly accessed again.
- Active: This is the amount of memory that is currently being used by active processes.
- Inactive: This is the amount of memory that is not currently being used but is still available to processes.
- SwapTotal: This is the total amount of swap space on the system.
- SwapFree: This is the amount of swap space that is not currently being used.
- Dirty: This is the amount of memory that is waiting to be written to disk.
- Writeback: This is the amount of memory that is currently being written to disk.
- AnonPages: This is the amount of memory being used by anonymous pages. Anonymous pages are pages that are not associated with any file.
- Mapped: This is the amount of memory that is mapped into the page cache. This includes files that are mapped into memory using the mmap system call.
- Shmem: This is the amount of memory being used for shared memory. Shared memory is memory that is shared between multiple processes.
- Slab: This is the amount of memory being used by the kernel slab cache. The slab cache is used by the kernel to store data structures that are used internally.
- SReclaimable: This is the amount of memory in the slab cache that can be reclaimed.
- SUnreclaim: This is the amount of memory in the slab cache that cannot be reclaimed.
- KernelStack: This is the amount of memory being used for kernel stacks. Kernel stacks are used by the kernel to store data for processes that are currently running.
- PageTables: This is the amount of memory being used for page tables. Page tables are used by the kernel to store information about the layout of memory.
- NFS_Unstable: This is the amount of memory being used for NFS pages that are marked as unstable. NFS pages are pages that are being used by the NFS client to access files on an NFS server.
- Bounce: This is the amount of memory being used for bounce buffers. Bounce buffers are used by the kernel to store data that is being read from or written to devices that cannot handle physical addresses.
- WritebackTmp: This is the amount of memory being used for writeback buffers. Writeback buffers are used by the kernel to store data that is being written to disk.
- CommitLimit: This is the maximum amount of memory that can be allocated on the system. This is the sum of the MemTotal and SwapTotal values.
- Committed_AS: This is the amount of memory that is currently allocated on the system. This is the sum of the Active, Inactive, and SwapTotal values.
- VmallocTotal: This is the total amount of virtual memory that is available on the system.
- VmallocUsed: This is the amount of virtual memory that is currently in use on the system.
- VmallocChunk: This is the largest chunk of virtual memory that is available on the system.
Method 4: Using the free Command
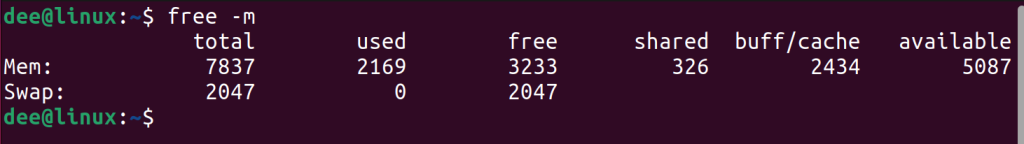
Free -m provides information on memory usage on a Linux system. The output is divided into three sections: total, used, and free. The total section shows the total amount of memory on the system, the used section shows the amount of memory currently being used, and the free section shows the amount of memory that is currently available.
- To use the free command, open a terminal and type:
- free -m: This will display the memory information in megabytes.
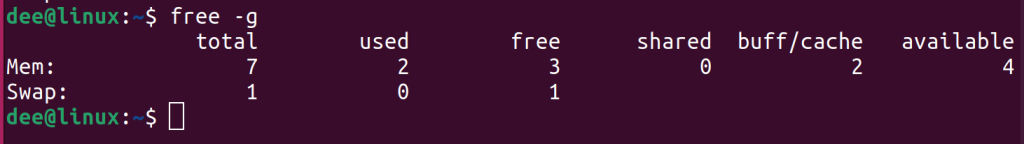
- You can also use the “free -g” option to display the memory information in gigabytes.
Method 5: Using the “vmstat” command
The vmstat command is a Linux utility that displays information about the virtual memory on a system.
- To use the “vmstat” command, open a terminal and type:
- vmstat -s
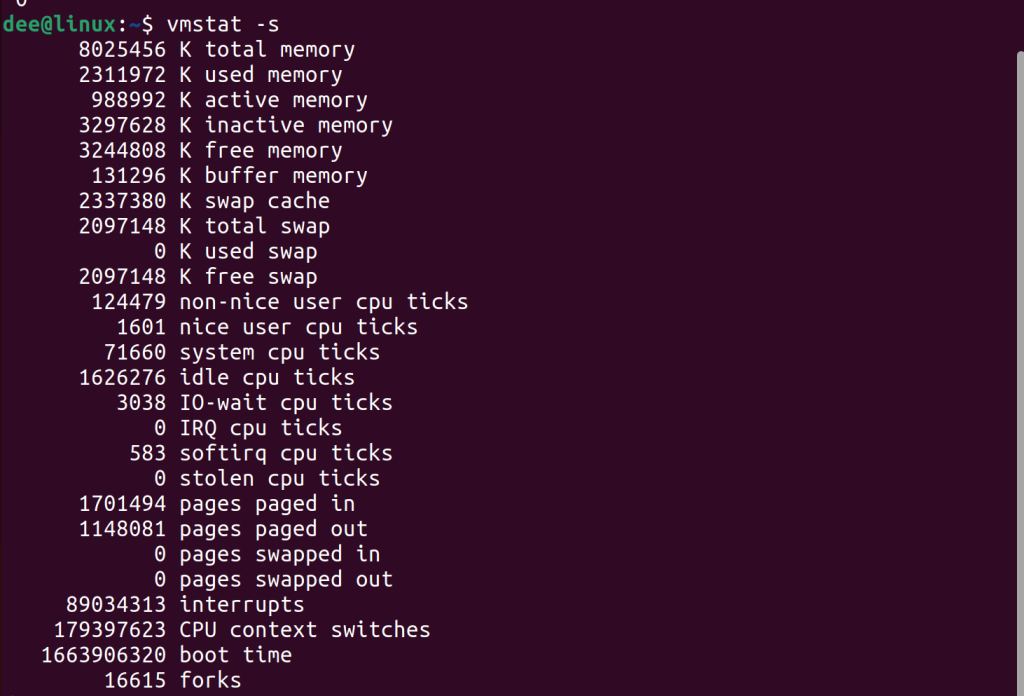
The vmstat command with the -s option displays a variety of statistics about memory, paging, block IO, traps, and CPU activity.
The statistics displayed by vmstat are:
Memory usage: total amount of free and used memory in the system, as well as the amount of memory used by the kernel.
Paging: amount of paging activity in the system, including the number of page faults, the number of pages swapped out, and the number of pages used by the kernel.
Block IO: amount of block IO activity in the system, including the number of blocks read and written.
Traps: number of traps received by the kernel, including interrupts, system calls, and exceptions.
CPU activity: amount of time the CPU spends in various states, including user time, system time, and idle time.
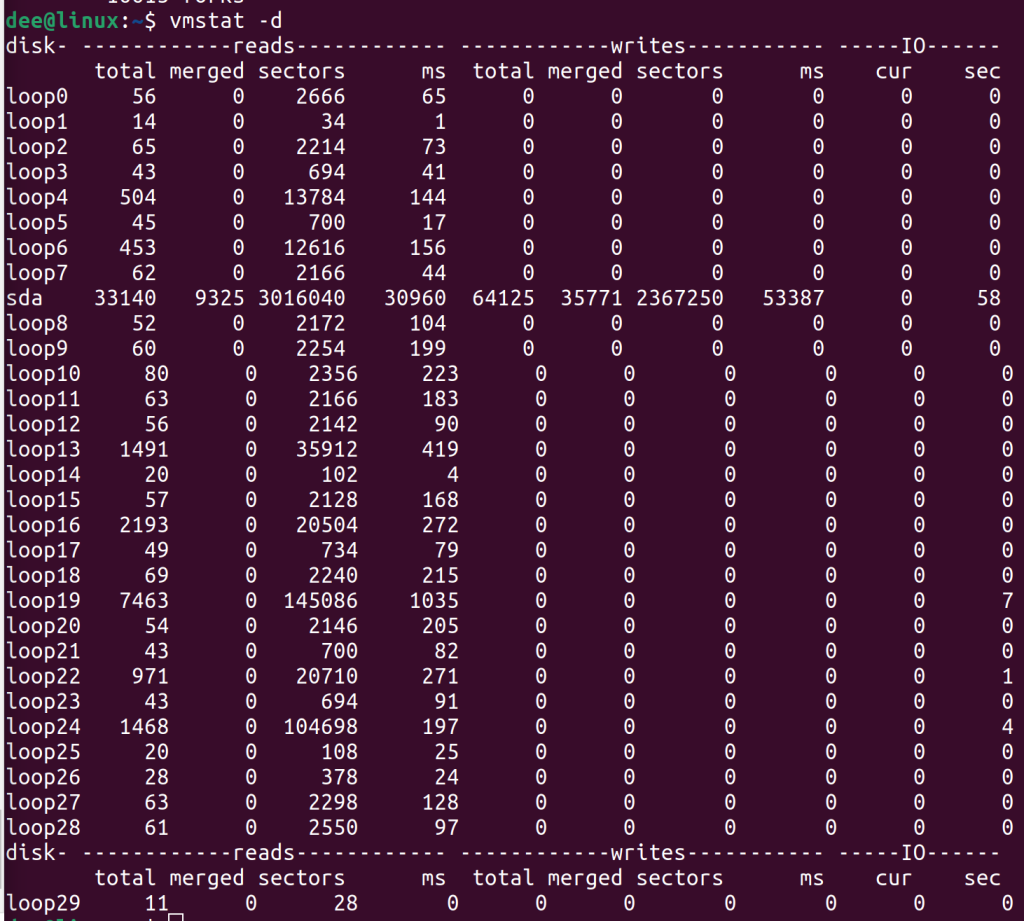
- You can also use the “vmstat -d” option to display the detailed information about the virtual memory.
Conclusion
In conclusion, checking the amount of memory that is being used is an important part of computer management. Ubuntu offers a number of easy-to-use and approachable GUI tools to check memory usage, while the “htop”, “cat”,”free”,”vmstat” commands are also accessible in the terminal.