In this tutorial, we’ll learn about the sar command in Linux! sar is part of the sysstat package which contains various utilities and tools, mainly for monitoring system performance and user activity. It is a tool within the sysstat package that collects, reports, and saves system activity.
Installing sysstat package
As we know sar is a tool in sysstat so we will have to first install and configure sysstat. To install on Ubuntu, you can simply execute apt command as a sudo user:
sudo apt install sysstat
To install on CentOS or other RHEL-based system, simply execute yum command as
sudo:
sudo yum install sysstat
Once we are done installing we can now proceed further configuring it.
To enable data collecting, edit /etc/default/sysstat and change ENABLED="false" to ENABLED="true".
Make use of the init system to enable and start sysstat,
sudo systemctl enable sysstat
sudo systemctl restart sysstat
After you have successfully installed sysstat, you can move to configure it. To test sar, type in the following command to check the version of the command and also to ensure that sar is correctly installed on your system.
sar -v
How to use the sar command?
Here we’ll learn some basics to get started with sar command. The syntax for the sar command given in it’s man page is:
sar [ -A ] [ -B ] [ -b ] [ -C ] [ -D ] [ -d ] [ -F [ MOUNT ] ] [ -H ] [ -h ] [ -p ] [ -q ] [ -r [ ALL ] ] [ -S ] [ -t ] [ -u [ ALL ] ] [ -V ] [ -v ] [ -W ] [ -w ] [ -y ] [ -z ] [ --dec={ 0 | 1 | 2 } ] [ --dev= dev_list ] [ --fs= fs_list ] [ --help ] [ --human ] [ --iface= iface_list ] [ --sadc ] [ -I { int_list | SUM | ALL } ] [ -P { cpu_list | ALL } ] [ -m { keyword [,...] | ALL } ] [ -n { keyword [,...] | ALL } ] [ -j { SID | ID | LABEL | PATH | UUID | ... } ] [ -f [ filename ] | -o [ filename ] | -[0-9]+ ] [ -i interval ] [-s [ hh:mm[:ss] ] ] [ -e [ hh:mm[:ss] ] ] [ interval [ count ] ]
We’ll tell you about the various flags of sar command in this section.
1. Reporting paging stats
To monitor the paging stats, run sar with -B flag,
sar -B 10 2
It will report you paging stats 2 times at the interval of 10 seconds.

2. Report I/O and transfer rate statistics
To report I/O and transfer rate statistics run sar command with –b flag,
sar -b 6 3
It will report you I/O and transfer rate statistics 3 times at a interval of 6 seconds.

3. Check memory utilization statistics
To check memory usage run sar command with -r flag,
sar -r 5 10
It will report you memory usage every 5 seconds, 10 times.

4. CPU Utilization statistics
To check memory usage run sar command with -u flag,
sar -u 2 4
It will report you cpu utilization 4 times every 2 seconds.

5. Swap space utilization statistics
To get report on swap space utilization statistics run sar command with -S flag,
sar -S 2 4
It will report you swap usage statistics at every 2 seconds interval, 4 times.

How to get more details on sar command?
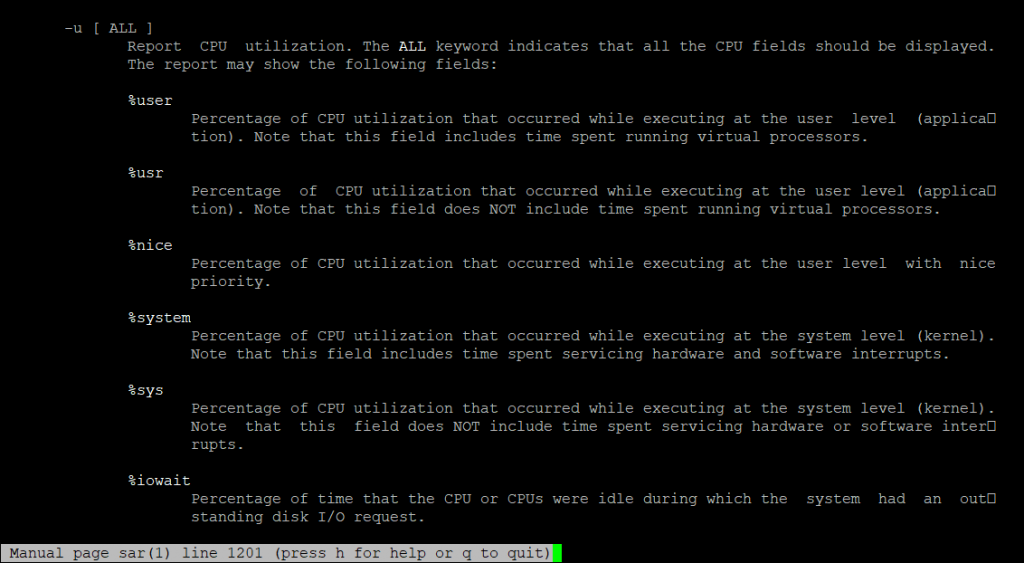
The best way to learn and go even deeper inside sar command would be to read its man page. It has details about every statistic you see when executing sar command.
You can access the sar man page directly through terminal, using man command:
man sar

Alternatively, you can also browse to https://linux.die.net/man/1/sar for sar’s man page.
Conclusion
Installing and using sar tool is very easy, the statistics are described beautifully in sar’s man page. It is very helpful in monitoring and generating report on various aspects of Linux. I hope you enjoyed learning with us! Happy learning! 😀
