

The load averages at the top of `top` can look alarming beside a CPU line showing plenty of idle time. I love the puzzle of numbers that seem to disagree until you know what each one measures.
The task rows give you a process-level view instead of another machine-wide reading. You’ll see how `top` sets its live system summary above the task list.
What the top command shows
The top command refreshes a system summary and a sortable list of processes or threads. The summary helps you read overall activity, while each task row shows resource fields for one process.
top
I launched top and pressed q, which returned me to the shell.
Use the arrow keys to move through process rows. The procps top manual documents the fields and controls for this implementation.
Check the installed top version
Interactive keys and displayed fields can differ between top implementations. Check the version before following a version-specific control.
top -V
I ran this command with procps-ng 4.0.4, and it printed the implementation without opening the monitor.

Read load, CPU, and memory separately
The central processing unit (CPU) summary contains several measurements, not one load score.
Load averages count runnable and uninterruptible work over 1, 5, and 15 minutes, so they are not CPU percentages. Compare them with the logical CPU count and watch whether they rise across refreshes, as the system-load guide explains.
| Summary field | What it reports | How to read it |
|---|---|---|
| Tasks | Runnable, sleeping, stopped, and zombie tasks | R is running or ready to run, S is interruptible sleep, D is uninterruptible sleep, T is stopped, and Z is a zombie |
| us, sy, ni | CPU time in user work, kernel work, and niced user processes | These percentages describe the interval since the prior refresh |
| id | CPU idle time | A high value means the CPU was idle for much of that interval |
| wa | CPU time waiting for input/output (I/O) completion | It does not identify the device causing the wait |
| hi, si, st | Hardware interrupts, software interrupts, and time taken by the hypervisor | Some fields depend on kernel and virtual-machine support |
| Mem total, free, used, buff/cache | Physical memory summary | Linux reuses cache, so free alone does not describe what applications can use |
| avail Mem | Estimated physical memory available to start applications | Includes reclaimable cache and memory slabs |
| Swap | Separate backing storage used for memory pages | Usage alone does not show whether swapping is active now |
CPU percentages cover the interval since top refreshed the screen. The load averages describe longer windows, so a brief wait can change the CPU line without moving the 5- or 15-minute average very much.
The avail Mem figure is more useful than free memory alone because it includes memory Linux can reclaim. This memory guide explains the estimate, while the swap line reports a separate resource.
A high wa reading is a reason to inspect activity over time, not proof of a particular fault.
Find and sort the process you need
Each process row starts with a process identifier (PID), then reports scheduling, memory, state, CPU, and command fields. These values describe one task, not the whole machine.
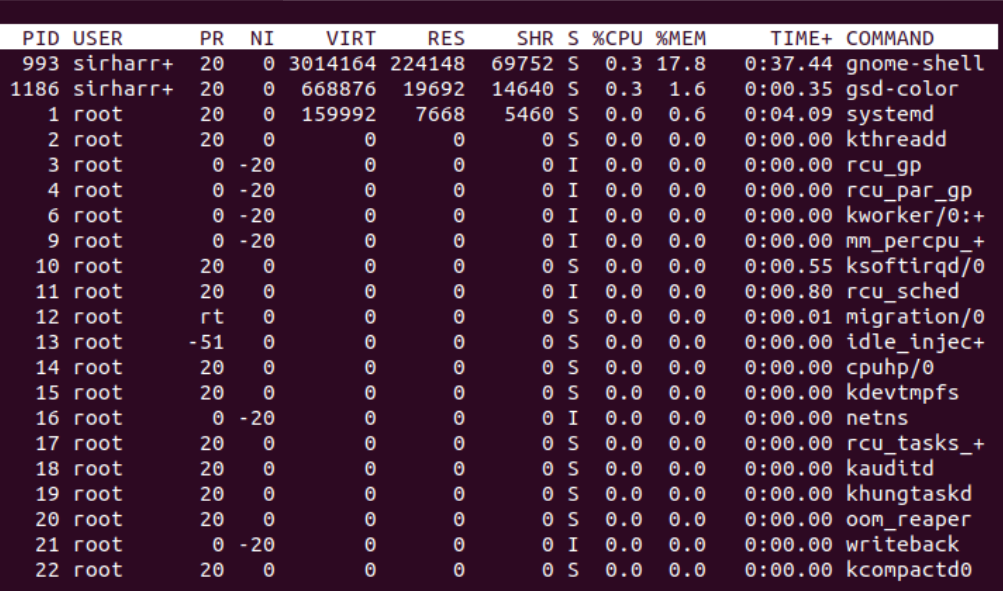
| Field | What it tells you |
|---|---|
| PID | Identifier used to select or signal a process |
| USER | Account that owns the task |
| PR | Scheduling priority shown by the kernel |
| NI | Nice value that adjusts scheduling priority |
| %CPU | CPU use attributed to the task during the refresh interval |
| %MEM | Resident memory as a share of physical memory |
| VIRT | Virtual address space, including mapped and reserved pages |
| RES | Resident physical memory currently used by the task |
| SHR | Part of resident memory that can be shared |
| S | Task state, such as running or sleeping |
| TIME+ | Accumulated CPU time since the process started |
| COMMAND | Program name or command line, depending on the display setting |
VIRT can exceed RES because its address space includes pages that are not resident in physical memory. RES can include shared pages, and SHR is a portion of RES, so do not add those columns together.
To identify resource-heavy processes across a larger list, see how to find top processes by memory and CPU use.
| Key | Sort order |
|---|---|
| P | CPU use |
| M | Memory use |
| N | PID |
| R | Reverse the current sort order |
Press the uppercase key while top is open. Sorting changes which rows appear first, but a short CPU spike can move a process between refreshes.
top -b -n 1 -w 120 -p "$$"
I ran this batch form against the shell process, and top returned one task row while keeping the summary system-wide. A single frame cannot show whether a value stays high.
Filter the list and change its view
Use u to filter by user, or o and O to set field filters with the case behavior shown in the table.
| Key | Action |
|---|---|
| u | Show tasks for a user |
| o or O | Enter a field filter. Lowercase o ignores case, while uppercase O matches case. |
| = | Clear filters from the current window |
| H | Toggle individual thread rows |
| V | Show processes in parent-child forest order |
| c | Toggle program name and command-line display |
| W | Save the current display and option settings |
Forest view groups child processes beneath their parents, which can reveal the service that started a task. H switches to thread rows, while c toggles command detail and W saves the layout for the next session.
Signal a process only after checking its PID
The k command opens the signal prompt, but it does not send anything until you confirm a PID and signal. Its default PID is the first displayed row, so read the prompt before accepting it.
- Press k, then enter the PID you intend to signal.
- Read the signal prompt. top defaults to SIGTERM, which asks the process to terminate cleanly.
- Use SIGKILL only when a process must stop immediately. It cannot handle the signal or clean up first.
Permissions still govern which processes you can signal, as the Linux kill command guide explains.
Use a top reading to choose the next check
A single top frame shows current activity, not a history of the machine. If load or I/O wait stays high, collect interval data before deciding whether a process, memory pressure, or storage activity needs attention.
vmstat 1 5
vmstat prints a since-boot average followed by four one-second samples. The r column counts runnable tasks, while b counts tasks blocked on input/output.
The si and so columns show swap movement. The vmstat command guide explains the other fields.
Linux top command FAQs
These quick answers cover the top questions that remain after reading the summary and process list.
How do I exit the top command?
Press q while the top screen has focus. This returns you to the shell.
Does load average show CPU usage?
No. Load average counts runnable and uninterruptible work over 1, 5, and 15 minutes. CPU percentages report time spent in CPU states during a refresh interval.
What does avail Mem mean in top?
It estimates physical memory available to start applications without swapping and includes reclaimable cache and memory slabs. It is not swap space.
How do I sort top by memory?
Press uppercase M in procps top to sort by memory use. Press P to sort by CPU use.
What does wa mean in top?
The wa field measures CPU time spent waiting for I/O completion. It does not identify the device or process causing the wait.