
In this article, We will discuss How to check server load in Linux. When running programs in the Ubuntu system, some programs might use high resources which may slow down your system or give a low performance. System Load or CPU load is the total number of processes running by the CPU. Server Load is the average server load in a given amount of time. This is calculated by the system and can be displayed in the command prompt through some commands that we will discuss below.
1. Uptime command
The uptime command displays how long the system has been running, the number of users, and load average in 1,5, and 15 minutes. Open a terminal by pressing Ctrl+Alt+T and execute the following command:
uptime
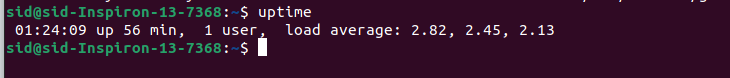
As shown in the image above, it is displaying an uptime of 56 min i.e. system has been running for 56 minutes since the last boot, and the number of users is 1. The load averages i.e. 2.82, 2.45, 2.13 are the averages calculated in 1, 5, and 15 minutes. More the load average means more is the load on the system.
2. vmstat command
vmstat command is used to display memory and CPU usage. It displays memory usage, swap disk usage, system, and CPU usage. Run the following command in a terminal window:
vmstat
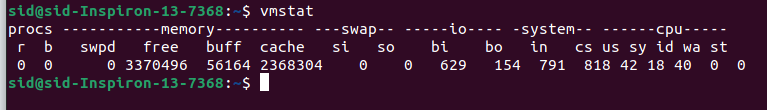
In this example, Running the vmstat command shows free, buffer, and cache memory. The si and so values are 0 which means the swap disk is not in use. Under the CPU tab, It shows the percentages of total CPU time: us means users, sy means system and id means idle, wa means waiting, and st means stolen time. You can refer to the vmstat manpage by running man vmstat or by clicking here.
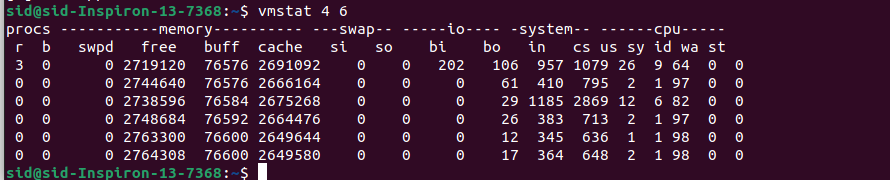
To run vmstat in an interval of X seconds, Run the following command:
vmstat <number of seconds> <number of times>
vmstat 4 6
3. Top command
The top command displays a list of processes running on the system. It gives real-time information about the system’s CPU and memory utilization. Execute the following command in a terminal window.
top
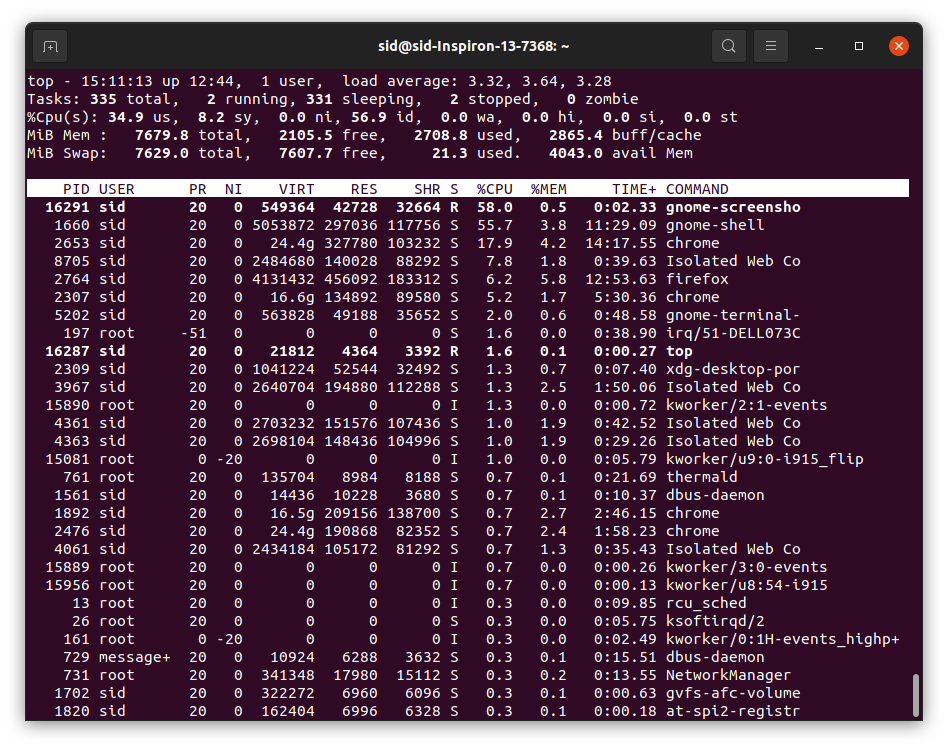
Here, It shows the uptime, load averages along with a list of real-time processes running with the percentage of memory and CPU usage. To know more about the top command, Run man top or click here.
4. mpstat command
mpstat doesn’t come pre-installed in Ubuntu. It is a part of the sysstat software bundle. To install mpstat, execute the following command:
sudo apt install sysstat
To run mpstat, execute the following command:
mpstat
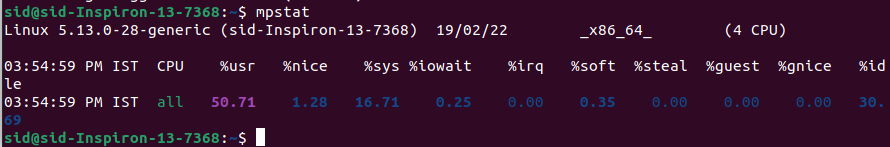
Here, It displays time utilized by the CPU at different levels i.e. %usr means CPU utilization at the user level, %sys means CPU utilization at the system level, %iowait means idle time spent by the CPU, %guest means time spent to run a virtual processor.
5. Glances command
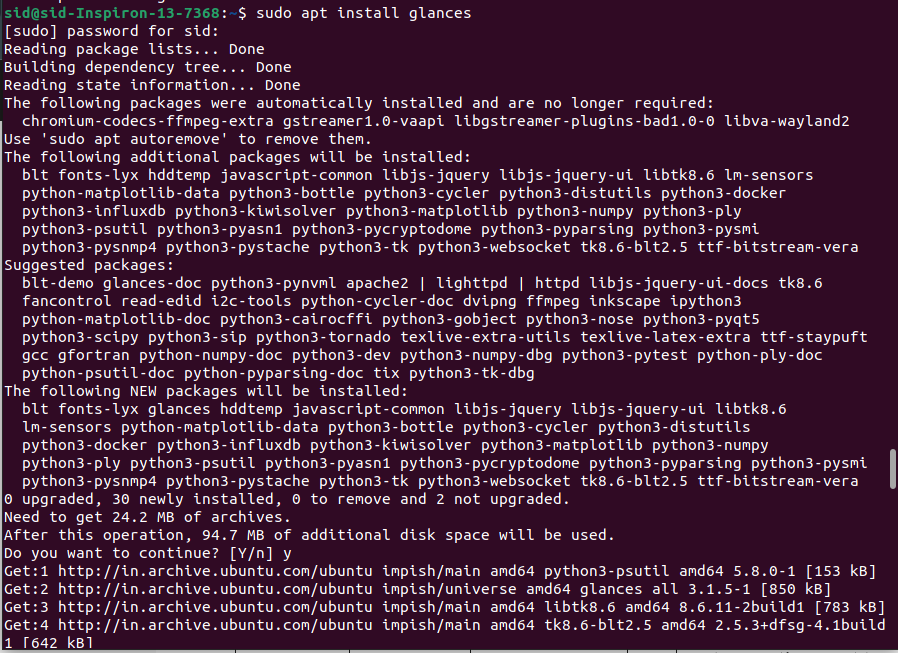
To install glances, Execute the following command:
sudo apt install glances
Run glances by executing the following command:
glances
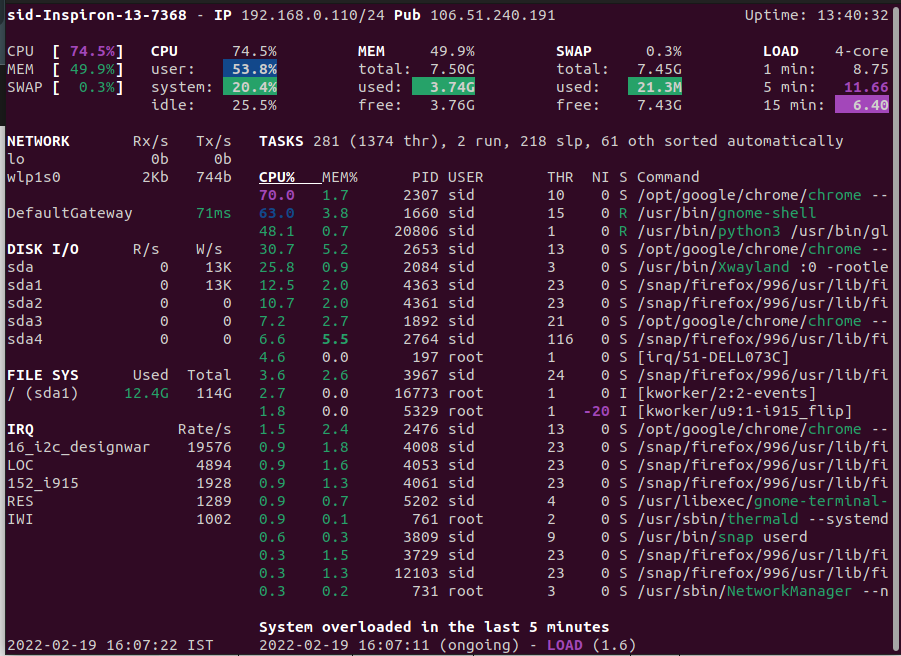
Here, It shows maximum information in less space. It displays the total memory usage, CPU usage, swap usage, load averages, Network, Disk I/O, IRQ, and a list of tasks currently running with their memory and CPU usage.
Conclusion
So, We discussed many ways to check the server load or system load in Ubuntu. You should always check the system load as sometimes the system gets overloaded by the processes running. Whenever the swap memory is utilized, it means the system is overloaded. I hope it works for you. Thank you for reading!