
Glances stands as an invaluable asset in the realm of system monitoring, offering a comprehensive, open-source solution that spans multiple platforms. Its prowess lies in its real-time surveillance capabilities, encompassing a diverse array of system vitals including CPU performance, memory allocation, disk utilization, and network activity.
However, its scope isn’t limited to these basics; it delves deeper, keeping tabs on running processes, user sessions, and hardware metrics like temperatures, voltages, and fan speeds. A standout feature is its seamless integration with container management systems like Docker and LXC, granting users the ability to monitor containerized environments effortlessly.
What truly distinguishes Glances is its user-friendly interface, which presents this wealth of information in a visually intuitive dashboard. This layout not only simplifies the interpretation of data but also facilitates remote monitoring, a functionality accessible both through a web interface and a command-line interface.
Its ease of installation and configuration makes it a go-to choice for tech enthusiasts and system administrators alike, offering a high degree of customization to tailor the displayed information precisely to one’s preferences. Glances embodies accessibility, versatility, and depth in its pursuit of empowering users to gain profound insights into their system’s performance.
What are the features of Glances?
This versatility in cross-platform monitoring ensures a cohesive and comprehensive oversight regardless of the operating system in use. By bridging the divide between Linux, macOS, and Windows, this monitoring capability empowers users with a unified view, streamlining processes, and enhancing efficiency.
This instant access to crucial performance metrics offers a live, dynamic view of system operations, allowing for swift decision-making and proactive responses. By continuously tracking CPU usage, memory allocation, disk I/O, and network activity in real-time, this monitoring capability provides an invaluable window into the health and efficiency of the system.
Comprehensive and elegant Information: the inclusion of hardware sensor monitoring, including temperatures, voltages, and fan speeds, ensures a vigilant eye on the physical health of the system, preempting potential hardware issues that could impact performance. Additionally, with support for container metrics in platforms like Docker and LXC, it offers visibility into the resource allocation and behavior of encapsulated environments, enabling efficient management and optimization
This intuitive dashboard is a user-friendly command center, distilling complex system data into clear, visually engaging representations. By presenting a wealth of information in an easily digestible format, it streamlines the process of assessing system health. Through visually appealing graphs, charts, and summary metrics, users can swiftly grasp the current status of critical parameters such as CPU usage, memory allocation, and network activity.
Ease of Use and Installation : Its accessibility stems not just from its powerful capabilities but also from its simplicity in both installation and operation. The straightforward installation process ensures that users, regardless of their technical expertise, can seamlessly integrate this monitoring system into their environment.
The system’s robust alerting and notification mechanisms stand as vigilant guardians, promptly signaling any deviations from established norms or critical system thresholds. Through configurable alerts, users can set parameters to trigger notifications when specific conditions arise, such as unusually high CPU usage, low memory availability, or erratic network behavior.
Low Power Consumption: This monitoring system operates with a remarkable efficiency that belies its extensive capabilities, ensuring it acts as a silent observer rather than an intrusive burden on the system it monitors. Its design prioritizes minimal resource consumption, allowing it to operate in the background without imposing undue strain on the system’s resources
Let us see the Installation process of Glances.
How to Install Glances on Linux?
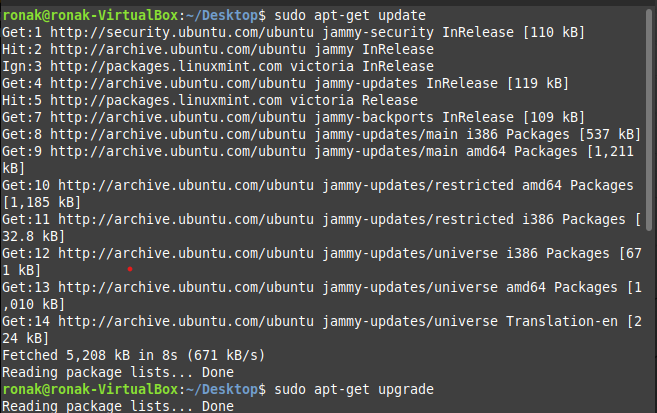
Before installing any software, make sure you update and upgrade your repositories to get all the latest versions of the software.
To update and upgrade your repositories, type the command:
sudo apt-get update
sudo apt-get upgrade
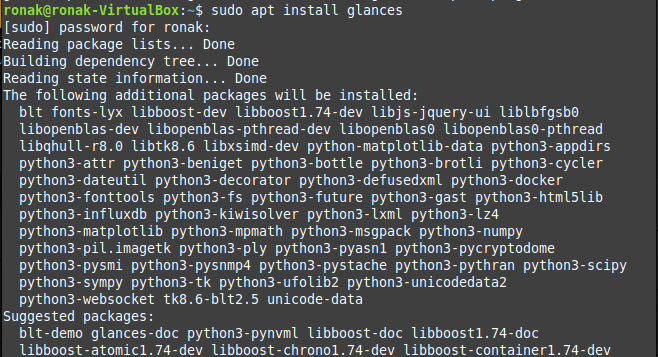
After the process is completed, you can use package managers to install the Glances. Open a terminal and run the following command:
sudo apt install glances
For Red hat Red-based systems, you can download using the yum package manager:
sudo yum install epel-release
sudo yum install glances
To install in Fedora, type inside the terminal:
sudo dnf install glances
To install in arch Linux, type inside the terminal:
sudo pacman -S glances
Glances can also be installed using python pip installation manager.
pip install glances
You can also install Glances from its source on GitHub:
git clone https://github.com/nicolargo/glances.git
cd glances
sudo python setup.py install
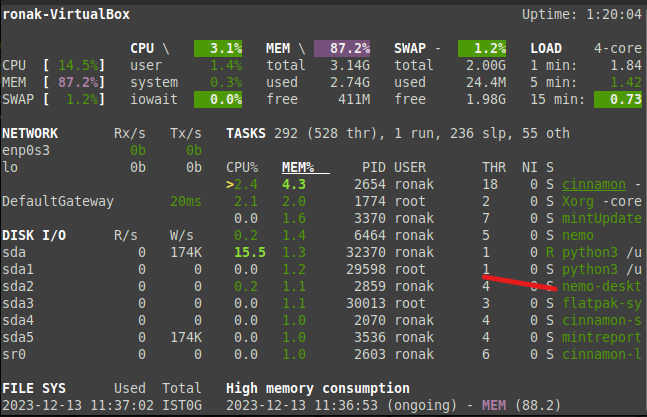
After the installation completes, you can run glances by simply typing “glances” inside your terminal.
Wrapping up this topic
Glances is a versatile, open-source system monitoring tool for Linux and various platforms. It provides real-time insights into system performance, showcasing essential metrics like CPU usage, memory allocation, disk activity, and network traffic. It can be a viable alternative to other system monitoring tools such as Htop.
Remember to use appropriate permissions (such as sudo) based on your system configuration when installing via package managers or from source. Choose the method that best fits your preferences and system environment to install Glances and start monitoring your system’s performance.
Reference
For more information, visit: https://github.com/nicolargo/glances