

A Linux machine can show little free RAM when you are checking whether another application has room to run. Linux memory management assigns physical pages to processes and cached file data as demand changes.
This article shows how to compare MemFree with MemAvailable and use vmstat to check for active paging.
TL;DR: Read Available Memory Before Swap Use
The swap total reports occupied space, while timed vmstat rows show whether pages are moving.
- Use MemAvailable for RAM headroom because its estimate includes reclaimable memory.
- Treat a nonzero swap total as stored allocation, then check interval swap-in and swap-out values for movement.
- Compare a later sample with the first one before attributing a change to the workload.
What Is Linux Memory Management?
Linux memory management assigns physical pages to process data and cached file contents as demand changes.
Page tables map each process’s virtual addresses to physical pages, and an access to an unloaded page triggers a page fault. A minor fault is resolved without disk I/O, while a major fault requires storage I/O. Repeated major faults can delay an application even when a later summary shows available RAM.
After RAM demand eases, swapped pages can remain stored until reused, allowing MemAvailable to rise while swap occupancy stays nonzero.
| Term | What it describes | Why it matters |
|---|---|---|
| Virtual address | An address a process uses in its own memory map. | The address is translated to a physical page when needed. |
| Resident page | A page currently held in physical RAM. | It can belong to one process or be shared by several. |
| Page cache | RAM holding file data for faster access. | Some cached pages can be reclaimed when demand rises. |
| Anonymous memory | Memory without a file backing, such as private application data. | It can remain resident or be backed by swap. |
| Swap allocation | Configured backing space currently occupied by swapped pages. | The used total describes occupancy. A rate describes movement. |
Clean file-backed cache can be discarded and read again when needed. Dirty file pages require writeback, while anonymous pages can use swap because they have no file copy.
Virtual Allocation and Physical Residency
A process’s virtual address map can include libraries and file regions it has not accessed, while RSS counts only pages resident in physical RAM.
| Reading | What it measures | How to interpret it |
|---|---|---|
| Virtual size | Addresses mapped by a process, including untouched ranges. | It does not mean every mapped page is resident. |
| RSS | Pages for that process resident in RAM. | Shared pages can appear in more than one process value. |
| CommitLimit | System limit for committed address space. | It reflects overcommit policy, not a paging rate. |
| Committed_AS | Amount of address space committed by the system. | It is an allocation-accounting value. |
Linux’s overcommit policy has three modes: heuristic (0), always-overcommit (1), and strict (2). Mode 2 uses a commitment limit based on swap and a configured RAM share. See the Linux kernel overcommit accounting documentation for policy details.
How to Check Memory Usage in Linux Step by Step
Start with free -h for the host summary, then use vmstat to observe paging during the workload.
Step 1: Read the System Memory Summary
Run free -h for a compact, host-wide summary of RAM and swap.
Save this read-only script as memory-summary.sh:
#!/usr/bin/env bash
set -eu
free -h
Run the named file from the directory where you saved it:
bash memory-summary.sh
jayant@linuxfordevices:~$ bash memory-summary.sh
               total        used        free      shared  buff/cache   available
Mem:            11Gi       4.4Gi       1.1Gi        88Mi       6.5Gi       7.3Gi
Swap:          5.9Gi       636Mi       5.3Gi
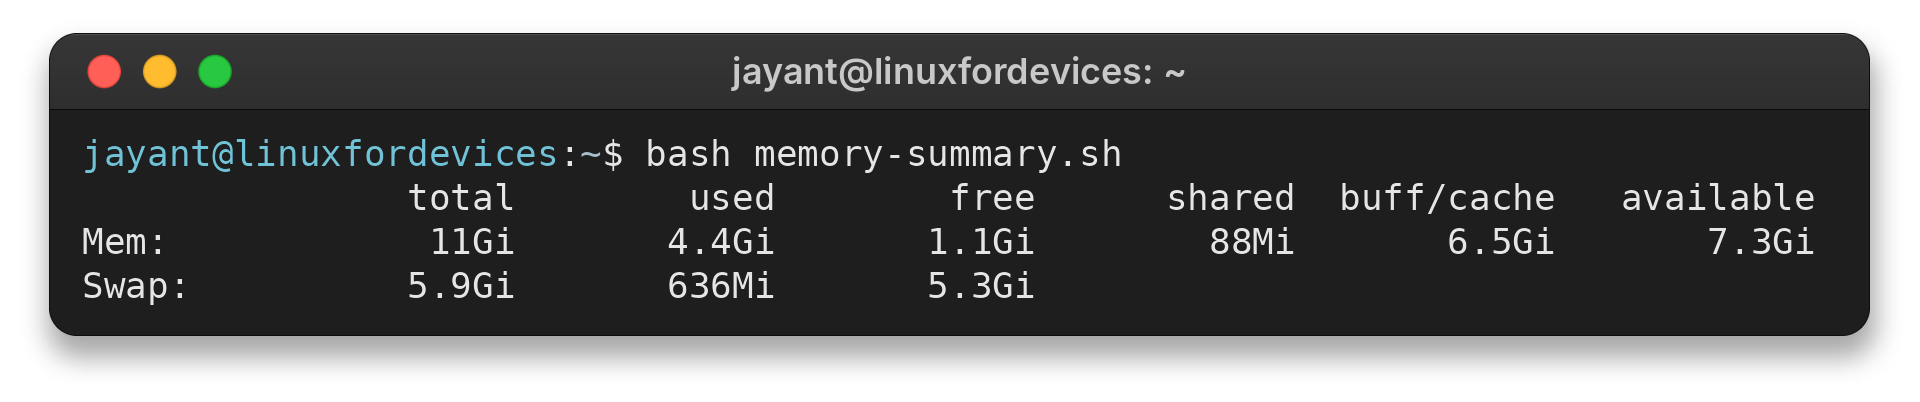
The capture shows 7.3Gi available and 1.1Gi free. I ran the named file to record this whole-system snapshot before checking interval rates.
| free column | How to interpret it |
|---|---|
| total | RAM visible to Linux after reservations. Swap has a separate total. |
| used | Total RAM minus MemAvailable. |
| free | RAM currently unused, not a complete measure of headroom. |
| shared | Memory used by tmpfs or shared-memory mappings. |
| buff/cache | Buffers and page cache, plus reclaimable kernel slab memory. |
| available | Estimate of RAM new applications can use without swapping. |
Free calculates used memory by subtracting MemAvailable from MemTotal, so reclaimable cache can be included. The site’s guide to the free command details the fields.
Step 2: Inspect the Available and Swap Counters
The summary is compact, while procfs exposes the underlying counters in kilobytes. Read only the fields needed for this question so the output stays focused.
Save this script as memory-fields.sh:
#!/usr/bin/env bash
set -eu
grep -E '^(MemTotal|MemFree|MemAvailable|SwapTotal|SwapFree):' /proc/meminfo
Run the file to print those five counters:
bash memory-fields.sh
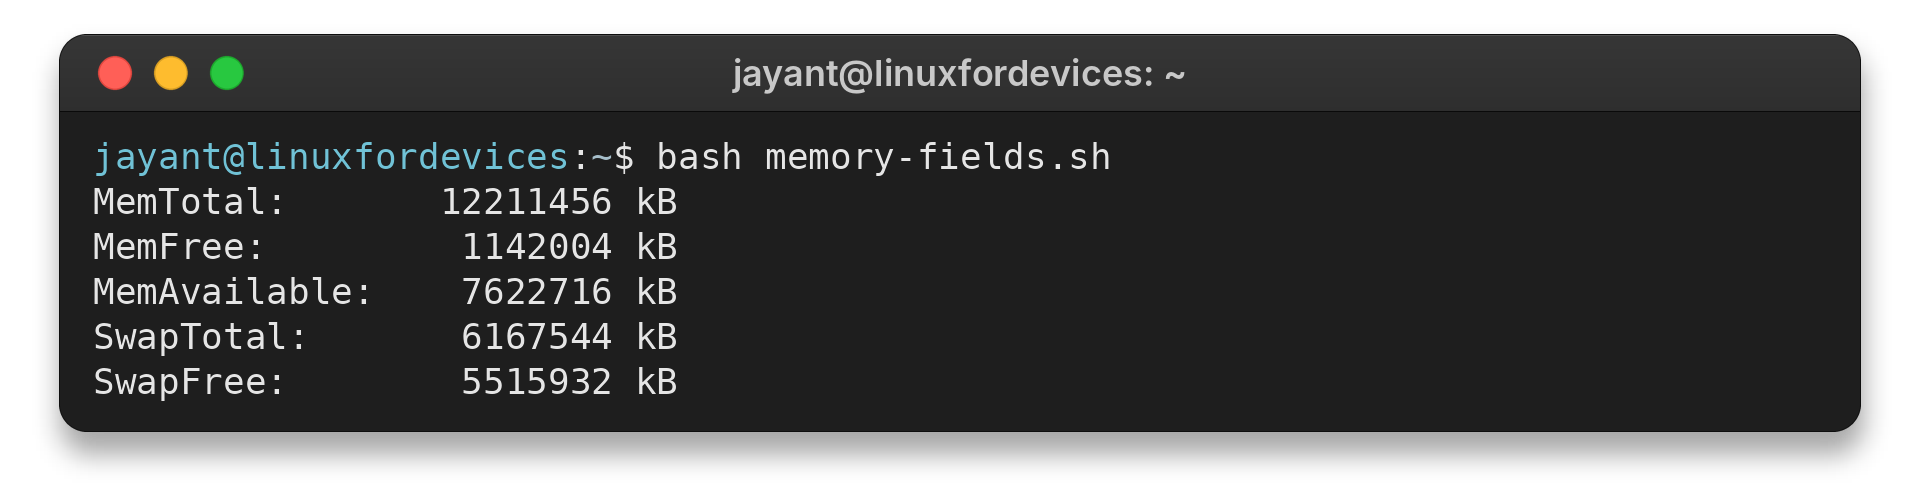
jayant@linuxfordevices:~$ bash memory-fields.sh
MemTotal:       12211456 kB
MemFree:         1142004 kB
MemAvailable:    7622716 kB
SwapTotal:       6167544 kB
SwapFree:        5515932 kB
| Field | Meaning |
|---|---|
| MemTotal | Usable RAM visible to Linux after kernel reservations. |
| MemFree | RAM pages currently unused. |
| MemAvailable | An estimate of RAM new applications can use without swapping. |
| SwapTotal | Configured swap capacity. |
| SwapFree | Swap capacity not currently occupied. |
This capture shows MemAvailable at 7,622,716 kB and MemFree at 1,142,004 kB. Compare the values again if the workload changes.
A cgroup limit or competing workload can reduce the memory available to a particular service even when host counters look ample.
Step 3: Check for Active Paging
Collect a short vmstat sample while the workload is active.
Save the following as paging-samples.sh:
#!/usr/bin/env bash
set -eu
vmstat -S M 1 3
Run the named file to take the samples:
bash paging-samples.sh
jayant@linuxfordevices:~$ bash paging-samples.sh
procs -----------memory---------- ---swap-- -----io---- -system-- -------cpu-------
 r  b   swpd   free   buff  cache   si   so    bi    bo   in   cs us sy id wa st gu
 1  0    636    829    408   6218    0    0  1333   463 1735    9 25  4 69  1  1  0
 1  0    636    804    408   6222    0    0     0     0 2334 3464 71  8 21  0  0  0
 1  0    636    800    408   6222    0    0     0    16 2141 1348 48  6 46  0  0  0
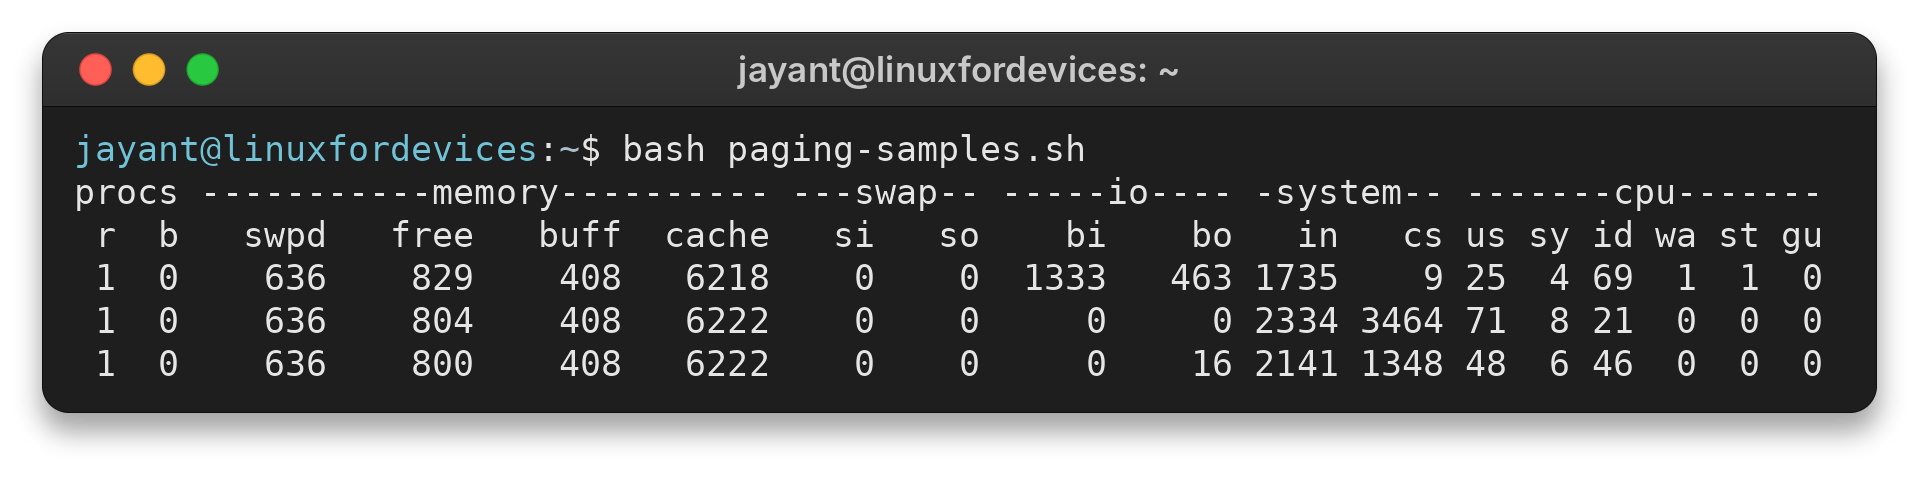
The first report gives averages since the last reboot. Later rows give one-second samples. Both interval rows show 0 for si and so, while swpd stays at 636 MiB.
I ran the named file to take two one-second samples after the since-boot report.
The -S M option keeps memory and swap values in MiB. M represents 1,048,576 bytes. Block I/O stays in KiB per second.
Linux manages pages rather than treating RAM as one undivided pool. The page cache holds file data, while anonymous pages hold process data without a file backing.
When reclaim cannot meet demand, the kernel may swap eligible anonymous pages or invoke out-of-memory handling.
Use the host summary for available RAM and timed vmstat rows for paging activity. Check cgroup counters when the service, rather than the host, appears constrained.
| vmstat field | What it reports |
|---|---|
| swpd | Amount of swap memory in use. |
| Swap-in rate (si) | Memory swapped in from disk per second. |
| Swap-out rate (so) | Memory swapped out to disk per second. |
| Block I/O (bi and bo) | Block-device input and output, in KiB per second. |
The bi and bo columns report block-device input and output separately from swap rates. File reads or other device work can raise them while si and so stay at zero.
For process-level follow-up, use the site’s guide to finding processes by memory and CPU use or its guide to the top command. Check the application and its service context if repeated system samples show movement alongside falling available memory. The vmstat guide explains the command’s other fields.
Interpret Linux Memory Readings Before Troubleshooting
I compared the captured summary with the interval sample because a single reading cannot show whether paging changed during the workload.
| Observation | What it suggests | Next check |
|---|---|---|
| MemFree is low while MemAvailable remains higher. | Reclaimable cache can account for the difference. | Use MemAvailable for headroom and compare it again if the workload changes. |
| Swap-in or swap-out repeats while available memory falls. | Paging is happening during the observation window, but the counters alone cannot name a cause. | Correlate the timing with application demand and its service limit. |
| A container approaches a memory limit although the host has room. | The cgroup limit can be lower than the host’s available RAM. | Inspect the service’s cgroup memory counters. |
| VmallocTotal appears to be the total virtual memory for programs. | VmallocTotal describes the kernel vmalloc address range, separate from process virtual address space. | Use a process-level virtual-size view when that is the question. |
| Adding process RSS values appears to exceed total RAM. | Resident set size can count shared pages in more than one process. | Use RSS to rank a process, not as a unique-memory total. |
Choose the counter that matches the failing scope: free describes the host, RSS describes one process, and cgroup files describe a service. In cgroup v2, memory.current reports usage for a cgroup and its descendants. Compare it with memory.max, the hard limit that may bind before the host runs out of RAM.
memory.high can trigger reclaim and throttle a cgroup without invoking the OOM killer. The events file keeps cumulative high, max, oom, and oom_kill counts. Compare readings before and after the symptom to see which event increased.
An increase in high without oom_kill is consistent with throttling. An increase in oom_kill records a process termination. Rising max or oom indicates activity at the hard boundary.
Host-level memory pressure has a different boundary. The kernel can invoke the OOM killer when it cannot reclaim enough memory for an allocation, so compare cgroup events with kernel records.
Conclusion: Compare Samples Before Changing Settings
When the host looks healthy but one service remains constrained, inspect that service’s cgroup counters before changing a limit. Use the matching check for each symptom: available RAM, timed paging, or a cgroup boundary.
Keep these references nearby when you need a deeper explanation:
- LinuxForDevices: checking available memory
- The free command manual
- The vmstat manual
- Linux kernel memory-management concepts
- The cgroup v2 memory controller
FAQ
Use MemAvailable for headroom and later vmstat rows for paging because those checks answer different questions.
Why is swap used when RAM is available?
Linux can move less active anonymous pages to swap to leave RAM for active work and cache. A nonzero swap total reports stored pages, not current swap traffic. Use timed vmstat samples to check for movement.
What does MemAvailable mean in Linux?
MemAvailable is the kernel’s estimate of RAM available to new applications without swapping, after accounting for reclaimable memory. It gives better headroom information than MemFree by itself.
How can I tell if Linux is swapping right now?
Compare successive vmstat reports and watch si and so. The first report is an average since boot, so use the later interval reports to check current movement.
Why can MemFree be low while MemAvailable is higher?
The kernel can reclaim some cached memory when applications need pages. MemFree counts currently unused RAM, while MemAvailable estimates additional headroom. A later sample shows whether the reading changed.
Does a high RSS value mean a process owns that much RAM?
RSS includes resident pages that may be shared. The same page can appear in more than one process’s RSS, so adding process values can count it repeatedly.
Can a container be limited while the host has available RAM?
Yes. A cgroup can have a lower memory limit than the host’s available RAM. Compare memory.current with memory.max and check memory.events for limits or OOM activity.
What does the M unit mean in vmstat?
It scales memory and swap values to 1,048,576 bytes. The block I/O fields remain in KiB per second.