

Watching memory rise in GNOME System Monitor while deciding whether to open another app can make the available amount hard to judge. I’m intrigued that cache can count as used without being out of reach for new work.
Linux’s free counter captures pages unused at that moment, not every page it can hand to an application. The difference between those meanings is the right place to start.
Available memory is not the same as free memory
Linux keeps some RAM for the page cache and kernel buffers, then reclaims a share when an application needs memory, which means the unused figure can be low while the kernel’s estimate for new work is higher.
Look for MemAvailable when you need an estimate of memory that Linux can give new applications without swapping. I chose that field rather than adding free, buffers, and cache by hand because the estimate accounts for reclaimable page cache and slab memory.
| Field | What it reports | How to read it |
|---|---|---|
| MemFree | Physical pages unused at that moment | Not the full amount available to applications |
| MemAvailable | Kernel estimate of memory available without swapping | Use this for the quick availability answer |
| buff/cache | Memory used for buffers and page cache | Some can be reclaimed, but do not add it all to MemFree |
| Swap | Separate disk-backed memory space | Read it separately from physical RAM |
Linux memory management covers the wider relationship between physical memory, virtual memory, and kernel reporting.
What you need to choose a view
free gives the direct numeric estimate, while a monitor adds process or history details when you need that context.
- Terminal: free and /proc/meminfo show the estimate without installing a separate monitor.
- Process view: top is included with procps on Ubuntu, while htop may need to be installed for your distribution.
- Desktop: GNOME System Monitor needs a graphical session and the application installed.
Check available memory in five Linux views
free is the clearest estimate, while /proc/meminfo exposes the field. top repeats it with a process list, and htop or GNOME adds monitoring context.
Use free -h for a quick estimate
Run free with the human-readable option when you want the total, used, free, cache, and available figures together. I start with this view because its available column answers the question without making you calculate from the other fields.
free -h

The available estimate includes memory Linux can reclaim, so 588 MiB in the free column does not limit a new application to that amount.
The free command in Linux also supports interval-based samples when you want to see how availability changes during a workload. That shows whether the estimate falls as programs allocate RAM.
Read MemAvailable from /proc/meminfo
The kernel exposes MemAvailable in /proc/meminfo, and filtering that label gives you one line for a script or terminal check.
grep -E '^(MemTotal|MemFree|MemAvailable):' /proc/meminfo

The values are reported in kB, and they change as programs allocate or release memory. The memory-management reference explains other fields in the same kernel report.
Open the full report with cat when you need fields beyond the three memory totals shown above.
cat /proc/meminfo
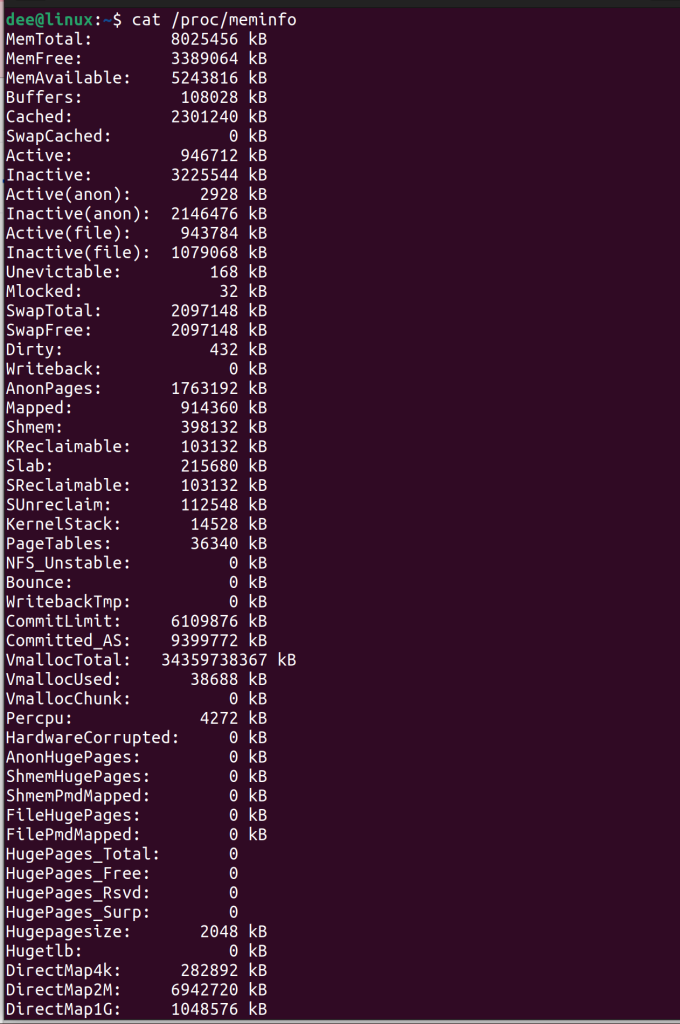
The full report includes swap, cache, and kernel-memory counters. Its figures are one point-in-time sample, so use the field names rather than comparing its values with your current output.
Watch the summary with top
top prints an available-memory estimate above its process list, and batch mode captures that summary without leaving the program open.
top -b -n 1 | head -n 6
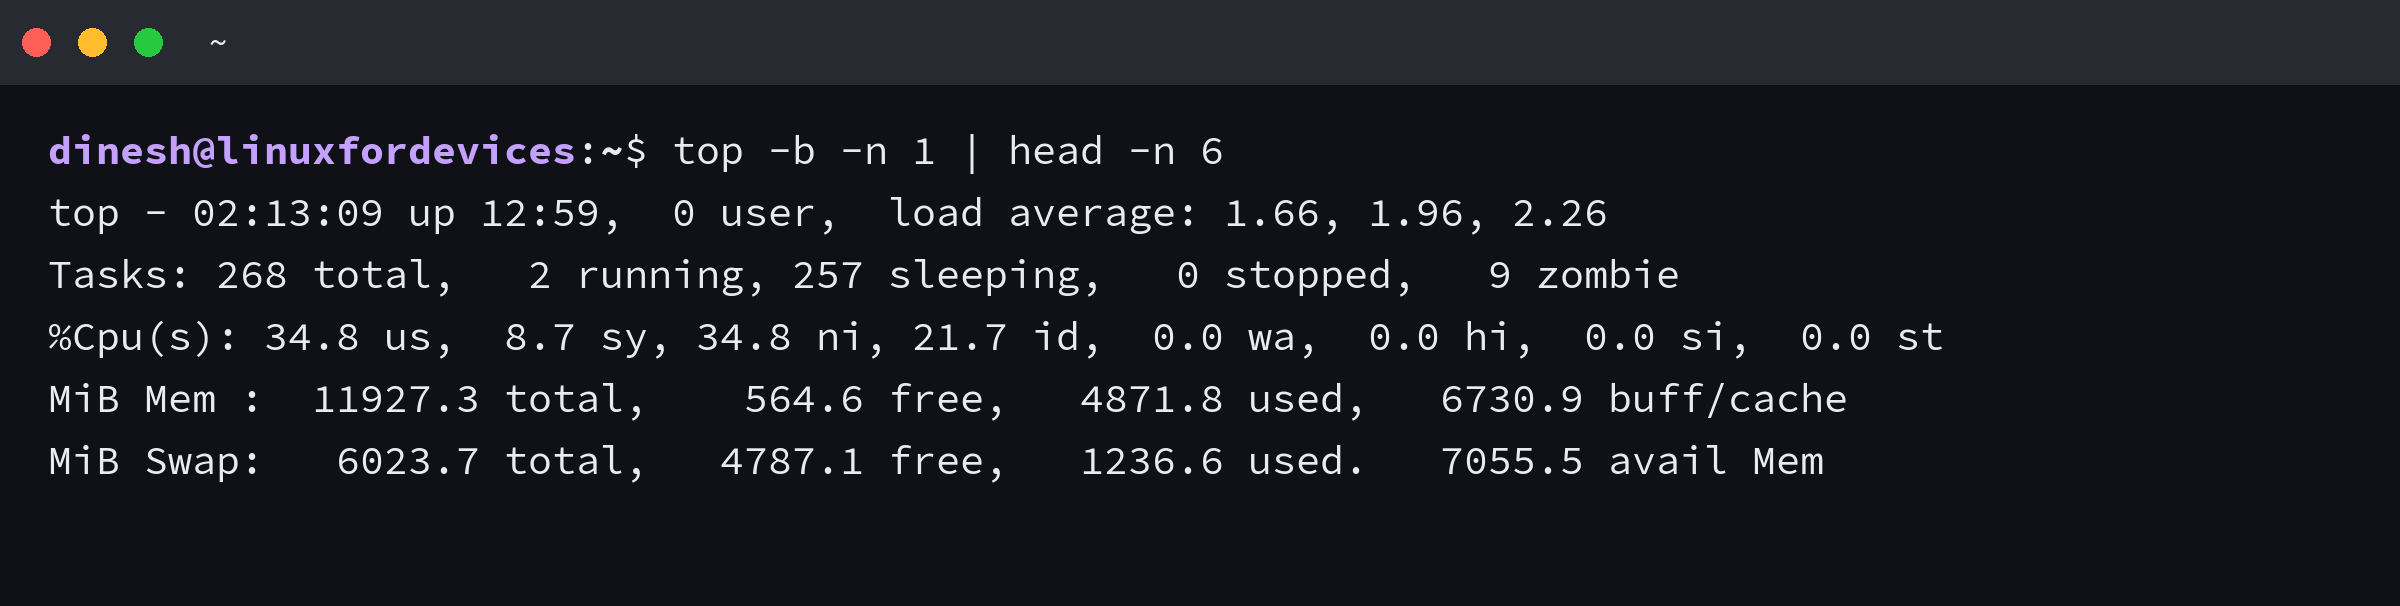
Look for avail Mem in the summary. The top command guide covers the process list and its interactive controls.
Use htop to locate process memory
htop adds a live process list and memory meter, so use it to locate individual consumers rather than treating its meter as the system-wide available estimate.
htop
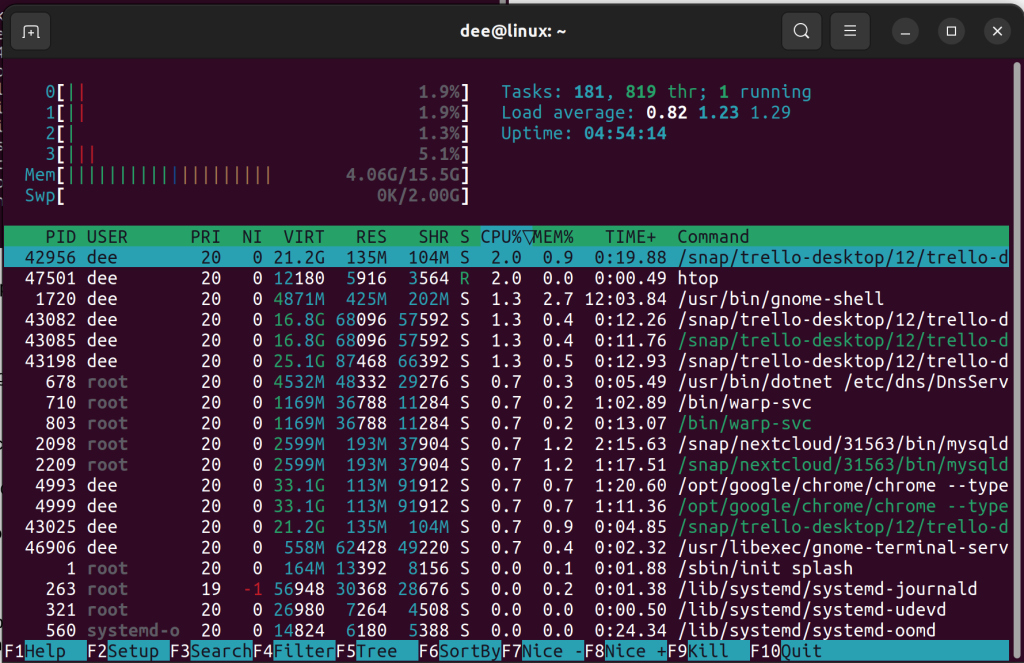
I chose htop for its process rows because they help locate memory consumers. The ps command in Linux offers another process-level view.
View memory and swap history in GNOME System Monitor
Open the applications grid with the Show Applications control marked in the screenshot.
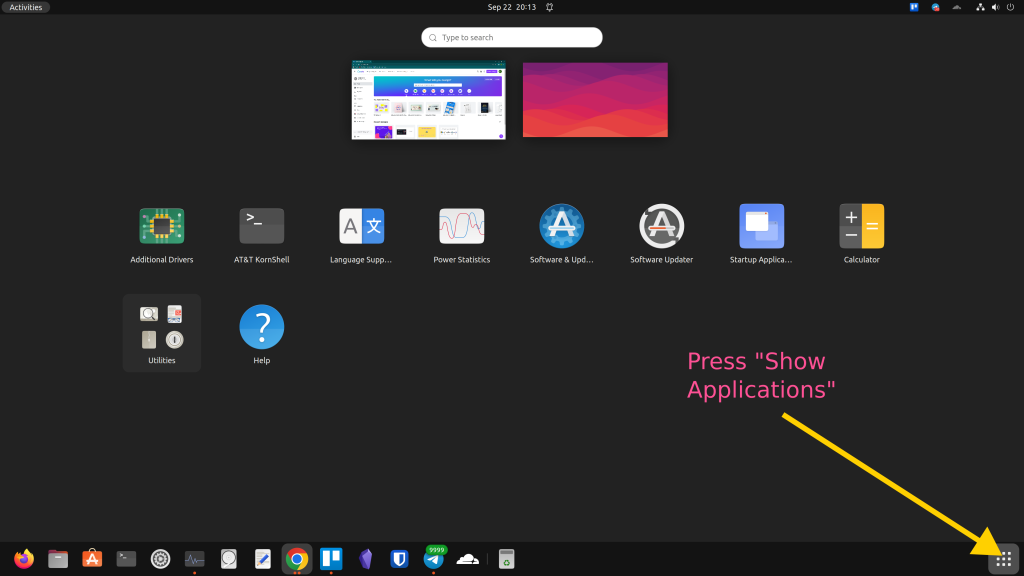
Search the apps view for System Monitor. Select its matching result to open the tool.
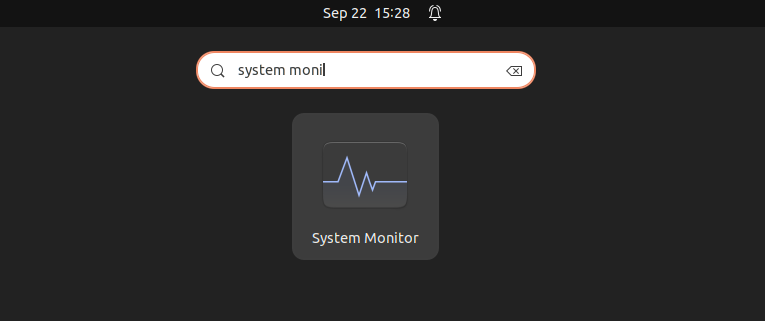
The Resources tab shows memory and swap history along with CPU and network activity.
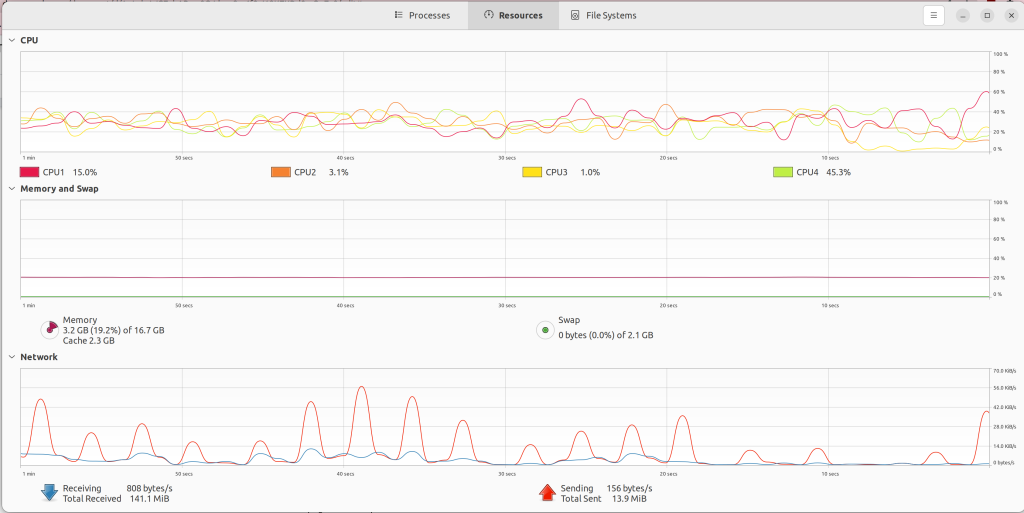
The Resources tab shows memory and swap history but does not label MemAvailable. Use free for the explicit estimate, and the htop command guide for its process view.
Why free RAM can look low
Linux can use idle RAM for cache and release some of it when an application asks for memory, so a low free number does not rule out room for a new program. MemAvailable is an estimate, not a promise that every byte can be allocated to one process.
| View | Useful for | Limit |
|---|---|---|
| free -h | One readable MemAvailable estimate | One snapshot, not a forecast of future allocations |
| vmstat -s | A broader memory and system-counter summary | Its free memory counter is not MemAvailable |
| Swap row | Seeing swap space separately from RAM | Swap is not physical memory |
Do not add MemFree, buffers, and cache to recreate the estimate. The vmstat memory statistics can help with broader activity, but read free or MemAvailable for the availability figure.
Read MemAvailable before changing anything
Check the kernel estimate before closing applications or changing swap. A low MemFree value alone does not show how much memory Linux can reclaim for new work.
free -h
Frequently asked questions
What command checks available memory in Linux?
Run free -h and read the available column. For the kernel field itself, read MemAvailable from /proc/meminfo.
Is free memory the same as available memory?
No. MemFree counts currently unused pages, while MemAvailable estimates memory Linux can provide to new applications without swapping, including reclaimable cache and slab memory.
Does vmstat -s show available memory?
vmstat -s reports a free-memory counter and other system statistics, not the MemAvailable estimate. Use free -h or read MemAvailable from /proc/meminfo.