

When a Linux machine seems short on memory, a terminal snapshot can show how much RAM and swap are in use. The free command reports those figures and estimates how much memory is available to new applications.
This article explains how to read the free and available figures and how to take a short series of memory samples.
TL;DR
The free command reports physical RAM and swap, and the available column is the quick estimate for memory Linux can give new applications without swapping.
- Run free -h for readable units.
- Read MemFree as unused pages and available as an estimate that includes reclaimable memory.
- Choose a bounded interval when you need to compare snapshots.
What Does the free Command Show?
The free command reports physical RAM and swap by reading counters from /proc/meminfo.
The Mem row reports usable RAM, currently unused RAM, and an estimate of memory available for new applications. That estimate accounts for reclaimable cache, but it is not a promise that every reported byte can be allocated to one process. The used figure is calculated from total minus available, so it can include kernel and cache usage rather than only application memory.
buff/cache combines kernel buffers and page cache, which Linux uses to reduce repeated disk reads. The shared column reports memory used by tmpfs and other shared-memory uses.
The Swap row reports configured capacity, used space, and unused space.
Values default to KiB, with 1024 bytes per KiB. Linux exposes the underlying counters through /proc/meminfo, which is a virtual kernel interface rather than a disk file.
How to Read and Monitor Memory with free
Start with a readable snapshot, then choose units or a sampling interval only when the question calls for them. I prefer -h for an initial check because it keeps the RAM and swap figures together with their units.
Step 1: Display readable memory figures
Run the command without changing system settings. The -h option scales values to short binary units such as Ki, Mi, and Gi.
free -h
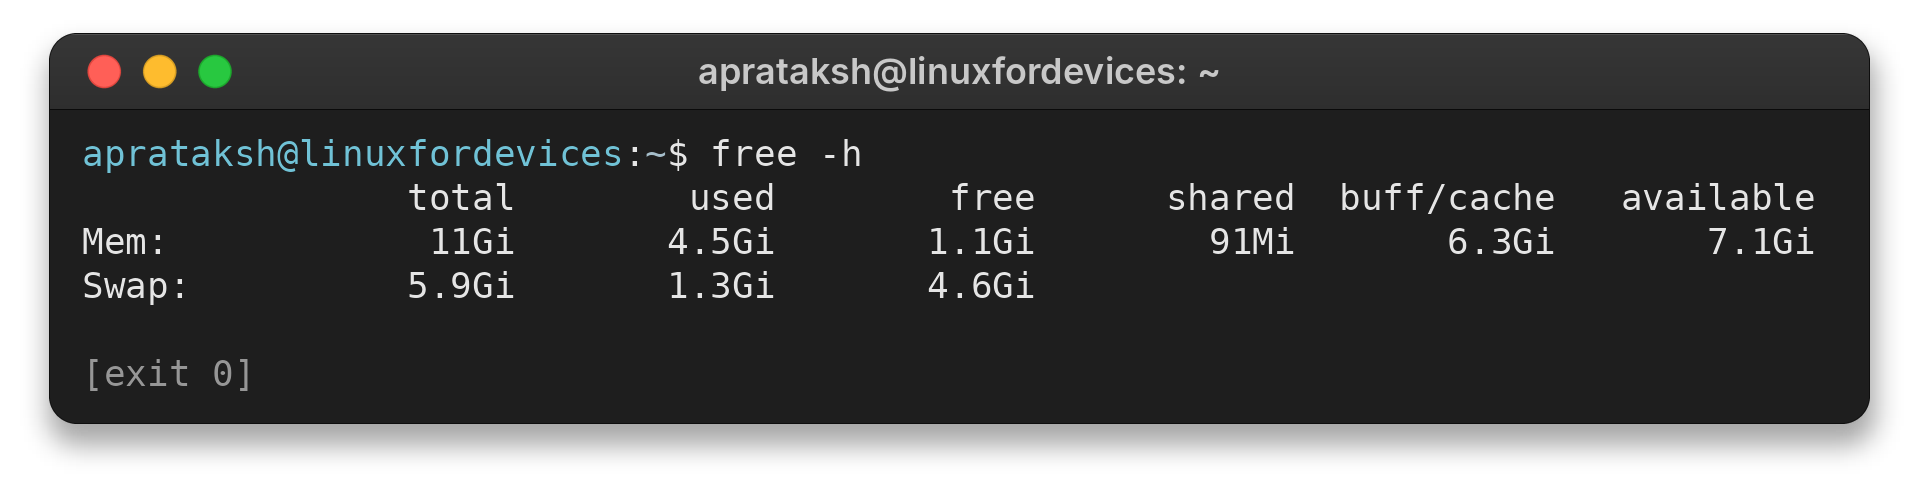
aprataksh@linuxfordevices:~$ free -h
               total        used        free      shared  buff/cache   available
Mem:            11Gi       4.5Gi       1.1Gi        91Mi       6.3Gi       7.1Gi
Swap:          5.9Gi       1.3Gi       4.6Gi
The first row shows RAM. The second shows swap. The output here gives 7.1 GiB available and 1.1 GiB currently free.
Step 2: Choose binary or decimal units
Use an explicit unit when a script or report needs consistent scaling. The short options use 1024-based units, while the long SI options use 1000-based units.
| Command | Unit | Base |
|---|---|---|
| free -m | MiB | 1024 KiB |
| free -g | GiB | 1024 MiB |
| free --mega | MB | 1,000,000 bytes |
| free --giga | GB | 1,000,000,000 bytes |
Use --mega or --giga when matching decimal units in a report.
Step 3: Separate buffers and cache
With wide mode, I can see the two components separately. That helps when comparing kernel buffers with file cache.
free -h -w
The output separates buffers and cache, the components combined in buff/cache.
Step 4: Watch a bounded set of samples
Use -s for repeated updates and -c for a finite number of samples. Check the manual for supported forms.
free -h -s 2 -c 5
Without -c, updates continue until you interrupt the command. Choose a count for a short observation.
Check man free for options supported by the installed procps-ng version.
How Should You Interpret Low Free Memory?
A low free value alone does not establish memory pressure. Compare available memory over time and investigate the workload if the estimate remains low.
The estimate is kernel-derived, so older kernels may report it differently or fall back to the free figure when MemAvailable is unavailable.
| Observation | What it means | Next check |
|---|---|---|
| Low free, higher available | Some memory is used for reclaimable work | Compare available across samples |
| Available stays low | Less estimated headroom for new applications | Review workload and process memory |
| Swap used is nonzero | Some pages occupy swap space | Use interval samples to see change |
Use the vmstat command to compare swap activity across samples. The vmstat guide explains its counters.
Check the estimate in /proc/meminfo when you need a kernel field directly. The top command guide shows how to inspect individual processes, and Linux memory management covers related counters.
Common Errors with free
The free command can fail when the option is unsupported or when its output is read as a disk-space report. I check the installed manual before relying on less common flags because procps-ng versions can differ.
- Unsupported option: if free prints an invalid-option error, run man free and choose a flag documented for the installed version.
- Unbounded watch: if repeated output continues, use -c with -s to set a sample count and interval.
- Filesystem capacity: free reports RAM and swap. Run df -h to check mounted filesystem space.
For the next check, compare memory samples with vmstat or inspect process usage with top. I keep these checks separate because free summarizes system memory while the other commands answer different questions.
Conclusion: Read Available Memory First
Run free -h for a readable snapshot, then use the available figure to judge headroom.
For exact field definitions, see the free manual and the Linux kernel’s /proc documentation.
FAQ
These answers cover the common questions that remain after reading the memory summary.
What does the free command do in Linux?
It reports physical memory and swap totals, usage, unused memory, and an estimate of available RAM.
Is free memory the same as available memory?
No. Free counts currently unused pages, while available estimates memory Linux can provide to new applications without swapping, including reclaimable memory.
Does the free command check disk space?
No. It reports RAM and swap. Use a disk-space command for filesystem capacity.