

In this tutorial, we will learn how to install ELK stack on Ubuntu 18.04. Let’s first understand what is ELK stack. Elastic stack was formerly known as ELK stack.
What is the ELK stack?
ELK stack is the collection of open source products developed by the elastic. The following three things are performed:
- Collection of data: The user collects the data from different sources
- Analyze the data: processing the collected data
- Visualization: denotes the representation of data

Elastic Stack comprises of 4 components:
- Elasticsearch: It is the distributed No-SQL database that stores the data in JSON format. It is used for storing & searching the collected data. It was developed based on the Apache Lucene search engine. Check the Elasticsearch Official Documentation for more details.
- Logstash: It collects the data from different sources and streams the data in the processing pipeline or filtering the input data. It pushes the logs on to the elastic search. Note that, it collects both heterogeneous/non-heterogeneous data from various sources. Check the Logstash Official Documentation for more details.
- Kibana: It provides the graphical user interface. The user can display the data as required over the elastic search. It uses different types of visuals like bar charts, pie charts, world maps, heat maps, and so on. For more details, Check the Kibana Official Documentation.
- Beats: There are lightweight data collectors. It is just like Logstash but differs in the fact i.e. doesn’t filter the input data and it can collect data more easily than Logstash. Beats are the small software installed on different servers. Check the Beats official Documentation for more details.
For more details, check the Elastic Search Official Documentation.
Let’s understand how to install ELK stack in Ubuntu. There are some prerequisites of the ELK stack.
Prerequisites
There are some of the basic requirements of ELK stack.
- The system should be the root user or non-root user with the minimum requirements:
- Ubuntu 18.04 LTS
- 4 GB RAM
- 2 CPUs
- Java-8 should be installed in the system, required by Elastic Search and Logstash. Learn the tutorial on how to install Java in Ubuntu.
- Nginx installed in the system, required to handle Kibana. Learn the tutorial on how to install Nginx in Ubuntu.
Let’s dive into the installation process.
Install and configure Elasticsearch on Ubuntu
The first component of ELK stack is Elastic search which is the No-SQL database.
Import the GPG key
You need to import the GPG key. GPG or GNU Public Guard is a public key cryptography implementation. Check the GPG Official Documentation for more details.
You can use wget command to import the GPG key. Let’s have a look at the command below:
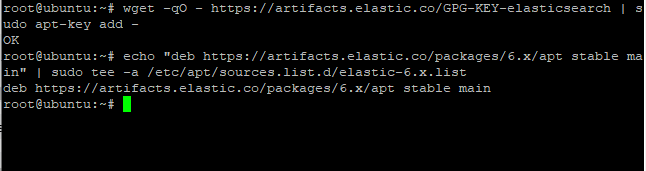
wget -qO - https://artifacts.elastic.co/GPG-KEY-elasticsearch | sudo apt-key add -
It should respond with OK. The next step is to add the elastic repository to the sources.list.d directory located in /etc/apt/. Use echo command and sudo tee command to send the output to the file. Let’s have a look at the command below:
echo "deb https://artifacts.elastic.co/packages/6.x/apt stable main" | sudo tee -a /etc/apt/sources.list.d/elastic-6.x.list
Update the packages
As of now, we have added the GPG key to the file. Therefore, it is required to update the packages. You can use the apt command to do so.
Learn the difference between apt and apt-get command. Let’s have a look at the command below:
sudo apt update
Install the Elasticsearch package
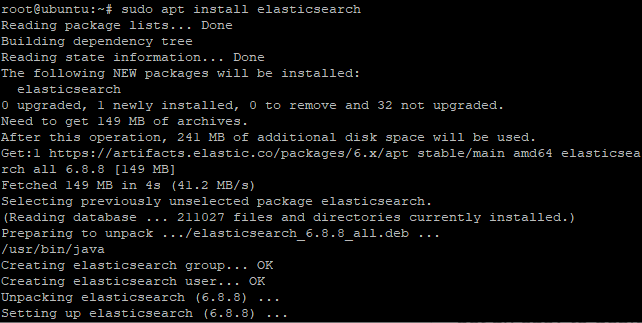
Once we are done with updating the packages, the next step is to install the package. It will be installed from the apt repository. Use the apt command to install the package.
To do so, type the following in the terminal:
sudo apt install elasticsearch
Basic configurations of Elasticsearch
The default port of the Elasticsearch is 9200. You need to make some modifications in order to make it safe from access to unwanted users. Therefore, you need to change the network host and the port.
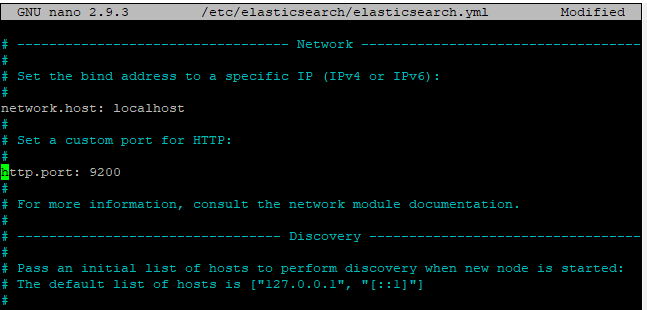
Make the changes in the elasticsearch.yml file located in /etc/elasticsearch/ directory. The required two changes are:
- Uncomment and change the network host to “localhost”
- As described earlier, uncomment the http.port attribute as Elastic search listens to port 9200.
Let’s have a look at the command below:
sudo vi /etc/elasticsearch/elasticsearch.yml
Use any editor of your choice. Make the changes as shown below:
network.host: localhost
http.port: 9200
Save and exit the changes using “:wq”.
Start and enable the services
Once we are done with the configurations, the next step is to start and enable the services. Let’s have a look at the command below:
sudo systemctl start elasticsearch
sudo systemctl enable elasticsearch
You can also check the status of the Elastic search using status command. To do so, type the following in the terminal:
systemctl status elasticsearch
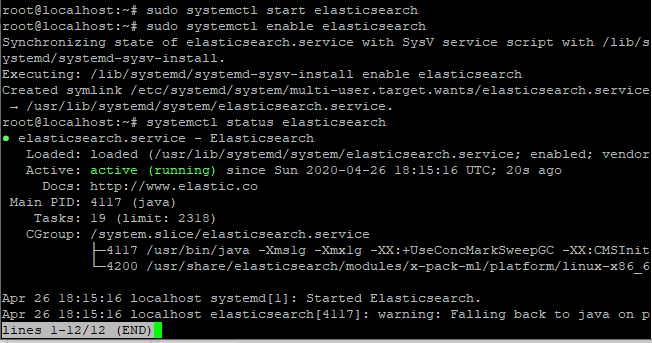
You can see the status as active highlighted in the image given above.
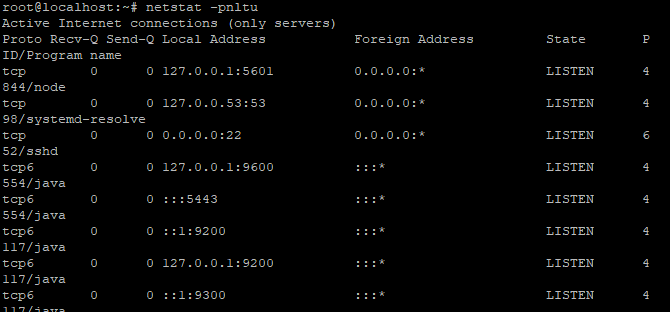
The alternate way to verify the status of the service is to use the netstat command. The netsat command is used to display the list of all running services in the system. Let’s have a look at the command below:
netstat -pnltu
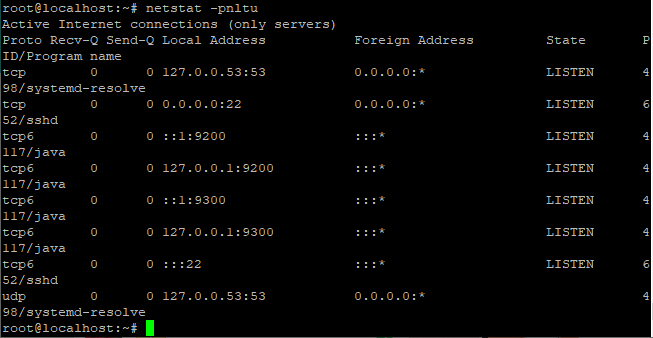
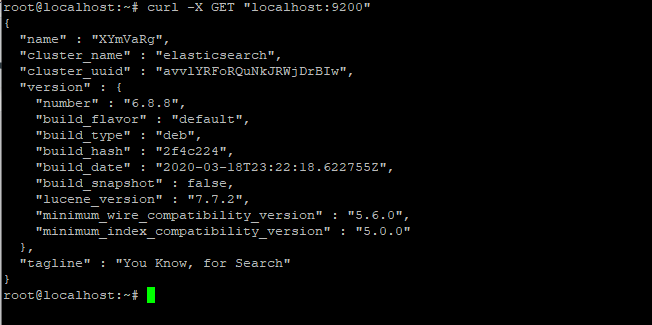
The default port of Elastic search is 9200 is active as shown in the image given above. You can also print the details of the service using the curl command. You need to mention the localhost so that it could fetch the data.
To do so, type the following in the terminal:
curl -X GET "localhost:9200"
That’s it. You have successfully configured the Elastic search. Next, we will look upon Logstash.
Install and configure Logstash
As described Logstash is used to collect and filter the input data. Here, we will install and configure the package. The filtered data is sent to the Elasticsearch as logs. Let’s understand how to install it.
Install the Logstash package
Here, we will see how to install Logstash. The first step is to confirm whether OpenSSL is running or not. To do so, type the following command in terminal:
openssl version -a
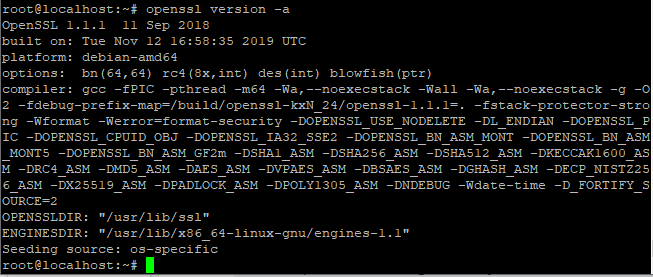
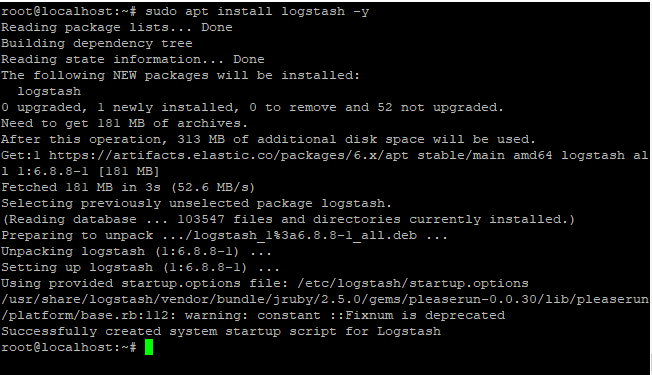
It’s working. So, let’s install Logstash in the system using apt command:
sudo apt install logstash -y
Basic configurations for Logstash
The work of Logstash is to filter the data i.e. it will take input from one and generate the output from after filtering it. Therefore, we need to create the three configuration files in Logstash.
- Input Configuration file: it is the input file from filebeat named “filebeat-input.conf”.
- Syslog Configuration file: It is used for processing the data named “Syslog-filter.conf”.
- Output configuration file: It will send the output to Elastic Search named “output-elasticsearch.conf”.
Let’s have a look at how to create the configuration files. But before proceeding for this, add the masterELK server IP address in /etc/hosts file. To do so, append the following line in the file:
<ip address> elk-master
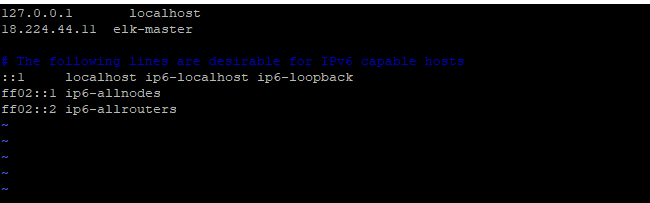
Remember to replace the IP address with your correct IP. In my case, 18.224.44.11 is the server IP.
1. Create input configuration file for Logstash
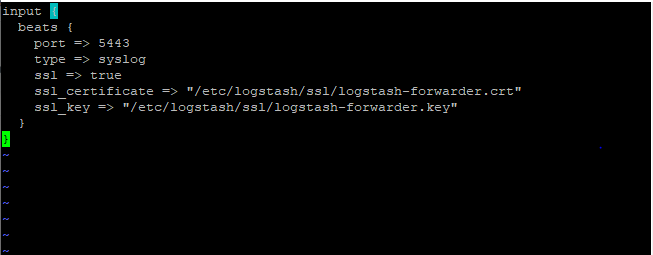
As discussed earlier, we will create the input configuration file named “filebeat-input.conf” located in /etc/logstash/conf.d directory. Let’s have a look at the command below:
sudo vi /etc/logstash/conf.d/filebeat-input.conf
You can use either nano or vi editor. Paste the following code as shown below:
input {
  beats {
    port => 5443
    type => syslog
    ssl => true
    ssl_certificate => "/etc/logstash/ssl/logstash-forwarder.crt"
    ssl_key => "/etc/logstash/ssl/logstash-forwarder.key"
  }
}
Save and exit the file using “:wq”.
2. Create the syslog configuration file
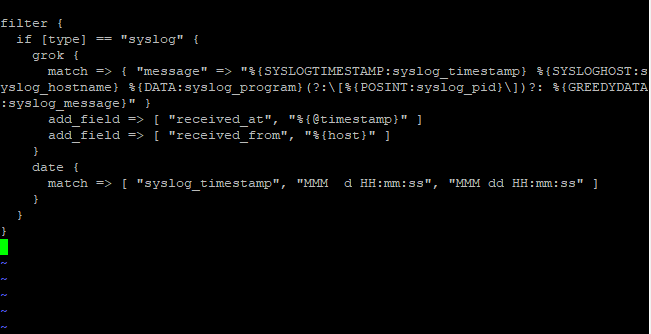
Earlier, we created the input configuration file. The next step is to create a Syslog configuration file named Syslog-filter.conf located in /etc/logstash/conf.d directory. Let’s have a look at the command below:
sudo vi /etc/logstash/conf.d/syslog-filter.conf
Add the following code as shown below:
filter {
  if [type] == "syslog" {
    grok {
      match => { "message" => "%{SYSLOGTIMESTAMP:syslog_timestamp} %{SYSLOGHOST:syslog_hostname} %{DATA:syslog_program}(?:\[%{POSINT:syslog_pid}\])?: %{GREEDYDATA:syslog_message}" }
      add_field => [ "received_at", "%{@timestamp}" ]
      add_field => [ "received_from", "%{host}" ]
    }
    date {
      match => [ "syslog_timestamp", "MMM  d HH:mm:ss", "MMM dd HH:mm:ss" ]
    }
  }
}
Save and exit the editor using “:wq”.
3. Create output configuration file
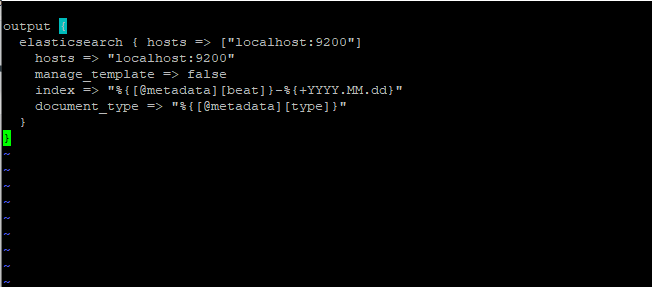
The last configuration file is the output configuration file named output-elasticsearch.conf located in /etc/logstash/conf.d directory. Let’s have a look at the command below:
sudo vi /etc/logstash/conf.d/output-elasticsearch.conf
Add the following code as shown below:
output {
  elasticsearch { hosts => ["localhost:9200"]
    hosts => "localhost:9200"
    manage_template => false
    index => "%{[@metadata][beat]}-%{+YYYY.MM.dd}"
    document_type => "%{[@metadata][type]}"
  }
}
Save and exit the changes.
Start the Logstash service
After successfully making all the configurations, the next step is to start and enable the Logstash services. Use the start and enable command to do so. Let’s have a look at the command below:
sudo systemctl enable logstash
sudo systemctl start logstash
We can also check the status of Logstash using status command. To do so, type the following in the terminal:
sudo systemctl status logstash
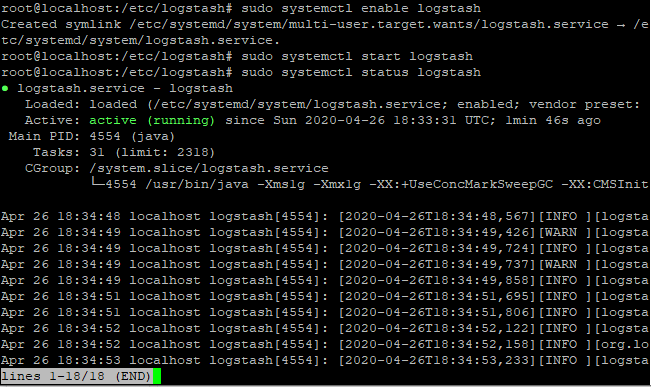
You can see the status as active highlighted in the image given above.
The alternate way is to use the netstat command to verify the Logstash service is running or not. Note that, the default port of Logstash is 5044. Let’s have a look at the command below:
netstat -pnltu
That’s it. We have successfully installed and configured the Logstash.
Install and Configure Kibana on Ubuntu
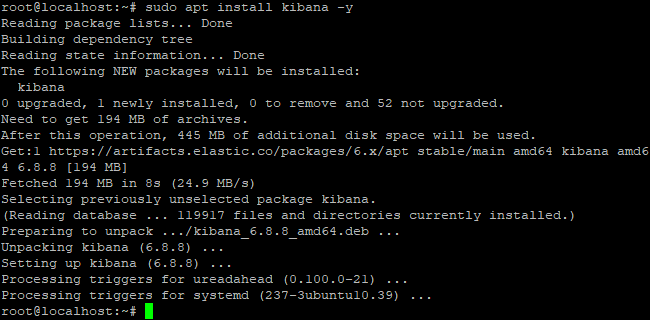
Kibana is used to create a UI interface. It discovers the data by exploring it. It also applies the Machine Learning on the data to get the data anomaly. Use apt command to install the package. Let’s have a look at the command below:
sudo apt install kibana -y
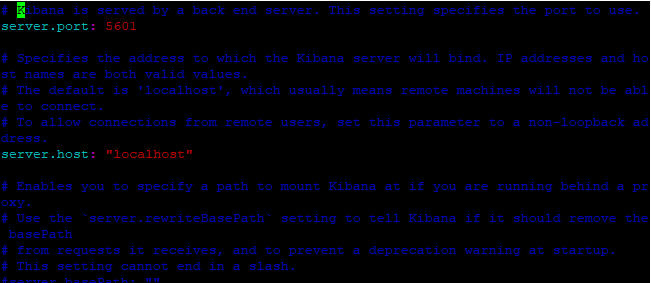
Basic configurations for Kibana
You need to make some configuration in kibana.yml file located /etc/Kibana directory. There are three modifications to be made :
- The default port of Kibana is 5601, therefore uncomment the server.port attribute.
- Uncomment the server.host attribute
- Uncomment the elastic search URL too.
Let’s have a look at the command below:
vim /etc/kibana/kibana.yml
You can use “?” followed by the searched keyword to search the attributes in vi editor. Uncomment the following attributes given below:
server.port: 5601
server.host: "localhost"
elasticsearch.url: "https://localhost:9200"
Start the Kibana service
After successfully making the configurations, the next step is to start and enable the services. You will use start and enable command to do so. Let’s have a look at the command below:
sudo systemctl enable kibana
sudo systemctl start kibana
You can also verify the status of the service using status command as shown below:
systemctl status kibana
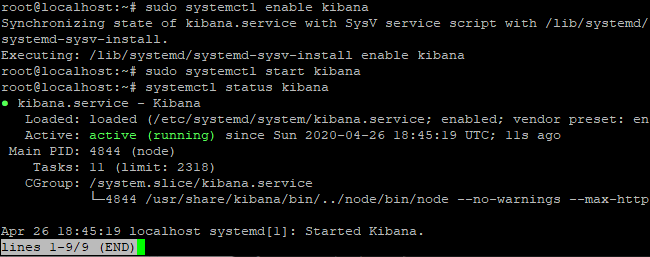
You can see the status as highlighted given in the above image.
The alternative way to verify the service is to use the netstat command. As discussed the default port is 5601, the user can notice the port running in the image given below:
netstat -pnltu
Basic configurations of Kibana with Nginx
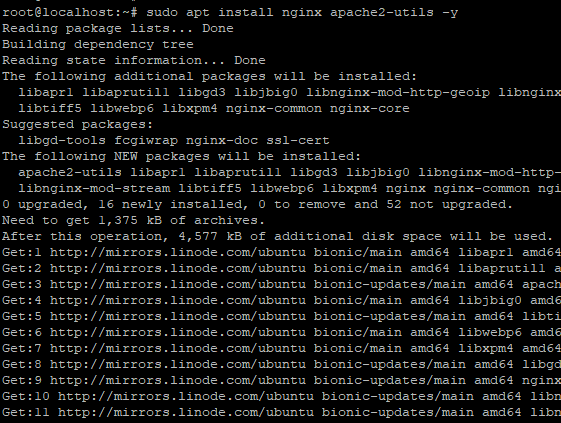
Kibana uses the Nginx server for the dashboards. It’s important to install Nginx and configure it. Learn the tutorial on how to install Nginx on Ubuntu. Let’s have a look at the command below to install Nginx and apache2-utils:
sudo apt install nginx apache2-utils -y
The next step is to create the virtual file named kibana located in the /etc/Nginx/site-available directory. Use any editor to open the file. Let’s have a look at the command below:
vim /etc/nginx/sites-available/kibana
Add the following code as given below. Note that, don’t forget to change the server name.
server {
    listen 80;

    server_name localhost;

    auth_basic "Restricted Access";
    auth_basic_user_file /etc/nginx/.kibana-user;

    location / {
        proxy_pass https://localhost:5601;
        proxy_http_version 1.1;
        proxy_set_header Upgrade $http_upgrade;
        proxy_set_header Connection 'upgrade';
        proxy_set_header Host $host;
        proxy_cache_bypass $http_upgrade;
    }
}
Save and exit the text editor.
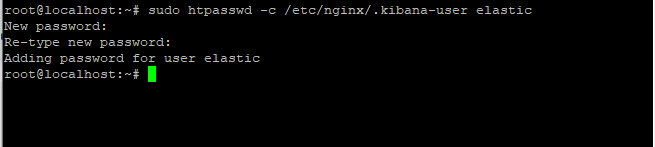
The next step is to create security for the kibana dashboard. It’s important so that unauthorized users don’t access the dashboard. Creating a secure password would only allow authenticated users to access the dashboard. Use htpasswd command to do so. Let’s have a look at the command below:
sudo htpasswd -c /etc/nginx/.kibana-user elastic
Type the strong password. It would look as shown in image below:
The last step is to reload the Nginx service. Whenever you make any changes in the configuration file, it’s important to reload the service again. Use the following command as given below:
systemctl restart nginx
Install and configure the filebeat
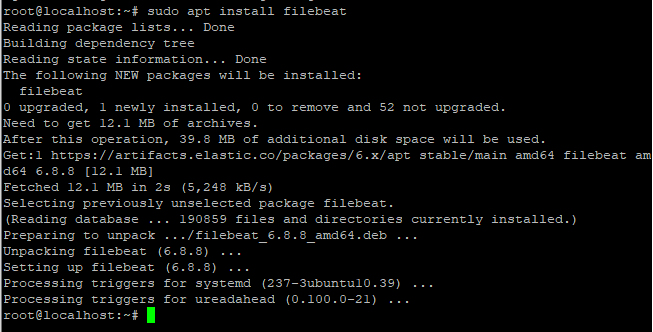
As described earlier, Beats are the lightweight collectors used to collect the data and send it to Elastic search. Use the apt command to download the package. Let’s have a look at the command below:
sudo apt install filebeat
Basic configuration for filebeat
Once we are done with the installation, the next step is to make the configurations. The changes are to be made in the file named “filebeat.yml” located in /etc/filebeat/ directory. You have to make various changes in this file. Let’s have a look at the command below:
sudo vim /etc/filebeat/filebeat.yml
The filebeat will not send any data directly to Elasticsearch. Therefore, you need to comment on the Elasticsearch section and uncomment Logstash section. Let’s have a look at this:
#Comment the following :

#output.elasticsearch:
# Array of hosts to connect to.
#hosts: ["localhost:9200"]

#Uncomment the Logstash section

output.logstash:
# The Logstash hosts
hosts: ["localhost:5044"]

# Enable the filebeat prospectors:
enable=true

# Add the path files

  paths:
    - /var/log/auth.log
    - /var/log/syslog
Save and exit the editor using “:wq”.
Start the Filebeat services
After making configurations, the last step is to enable the services. Use start and enable command to do so. Let’s have a look at the command below:
systemctl start filebeat
systemctl enable filebeat
The user can verify the status of the service using Status command as shown below:
systemctl status filebeat
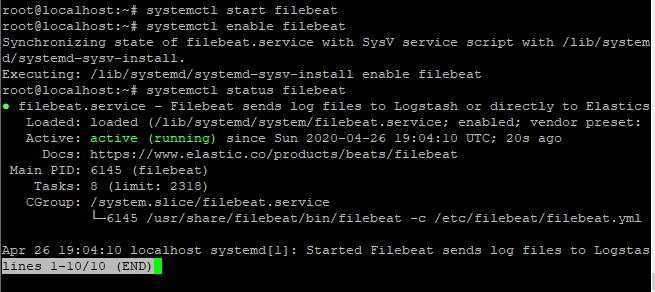
You can see the status as active highlighted in the above image.
Let’s begin with the Elasticsearch Stack
Once we are done with the complete installation of ELK stack, let’s check it on the browser. To do so, open the browser and add IP address followed by the port number i.e. 5601 in the Address bar. Let’s have a look at the command below:
ip-address:5601
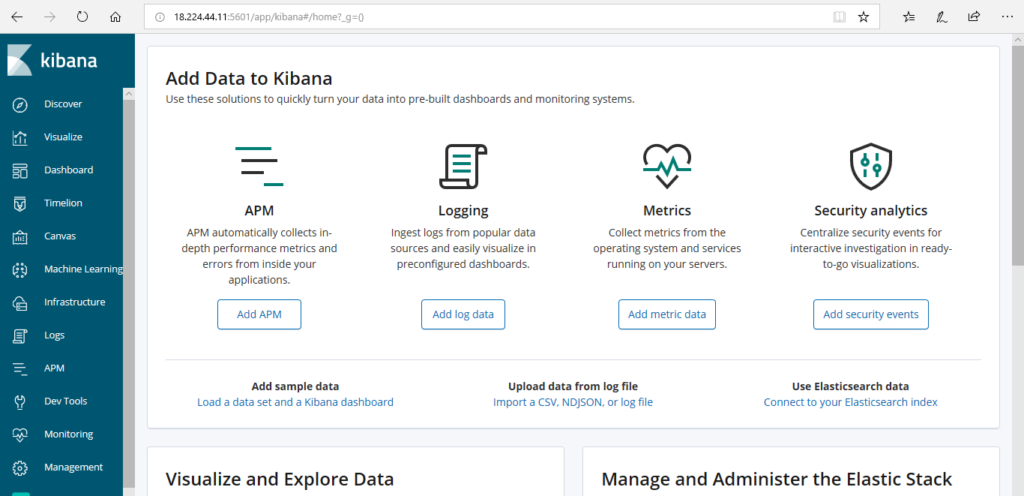
The user can check the visualized data by clicking on “Discover” tab.
Conclusion
That’s it. We now know how to install all the components of ELK stack followed by the Elastic Beat “filebeat”. I hope all the concepts are cleared. If you still face any issue, do let us know in the comment section.