

Checking CPU and GPU temperature on Linux matters the moment a fan spins up for no obvious reason or a render job that used to take ten minutes now takes twenty. A CPU running hot throttles itself to protect the silicon, and the only way to catch that before it slows everything down is to actually look at the sensor.
Linux doesn’t come with a very intuitive way of checking in on your CPU/GPU. So in this article, we look at several different ways you can monitor your hardware temperature levels, from a single command to full graphical tools, plus GPU, disk and Raspberry Pi temperatures.
Check CPU and GPU temperatures with lm-sensors
There are tons of third-party command-line utilities like as acpi, i7z and tmon to display the hardware temperatures but none are as elaborate and universal as lm-sensors which is a free and open-source application that not only provides CPU temperatures but voltage, and fan information too.
Ubuntu/Mint/Debian
sudo apt install lm-sensors
Arch/Manjaro Linux
sudo pacman -S lm_sensors
Fedora
sudo dnf install lm_sensors
lm-sensors or lm_sensors can be found in the official repositories of almost all distributions.
How to use
To check temperatures, first execute
sensors-detect
which will detect all the relevant sensors on the device. Say ‘y’ or ‘yes’ to all prompts. Older guides told you to run /etc/init.d/kmod start next, but that init script no longer exists on modern systemd distros. Reboot instead, and the detected modules load automatically.
Now execute the following the run the program.
sensors
and you will get a output something like this, listing all the necessary hardware info you need.
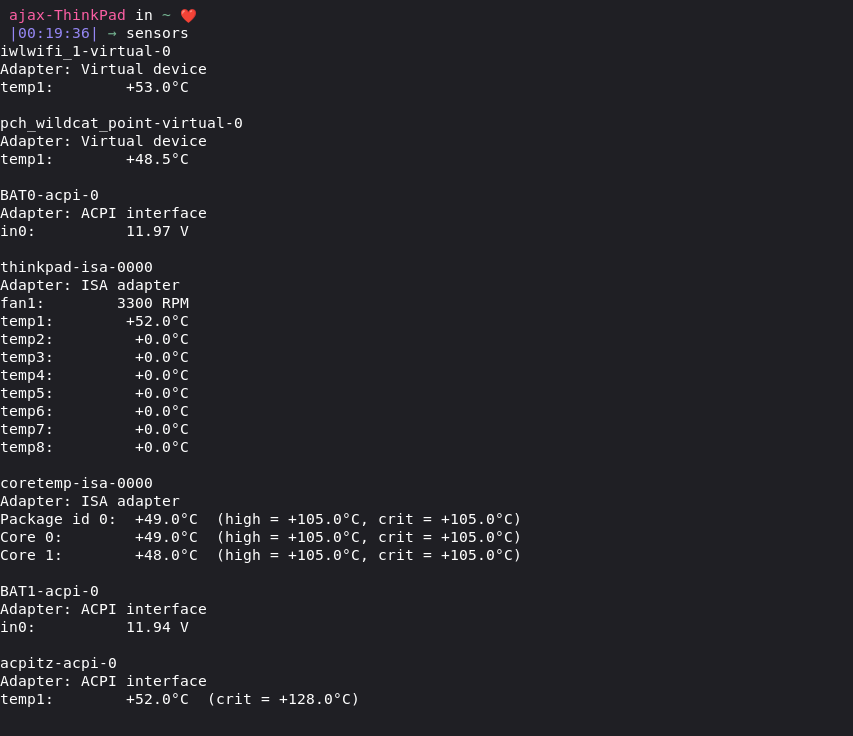
Watching it update live
Want the numbers to refresh on their own? watch -n 2 sensors reruns the command every two seconds in place, useful while stress-testing a machine and watching temperature climb.
Reading AMD Ryzen output
On a Ryzen or EPYC system, sensors shows a k10temp chip with two confusing labels. Tctl carries a vendor-added offset for fan curves, sometimes 10 to 27°C above the real number. Tdie is the actual die temperature, the one worth alerting on. If your kernel only exposes Tctl, subtract the documented offset before trusting the reading.
Check CPU and GPU temperatures with psensor
If you don’t want to open up your terminal again and again and want a graphical option to check your temperature, you can get psensor which not only displays you real time sensors data but makes easy to read graphs so you can monitor and analyze hardware performance.
psensor depends on lm-sensors for CPU and GPU temperature and, optionally, smartctl for drive temperature. Install lm-sensors first, then psensor.
Ubuntu/Mint/Debian
sudo apt install lm-sensors
sudo sensors-detect
sudo apt install psensor
psensor
Arch/Manjaro Linux
sudo pacman -S lm_sensors
sudo sensors-detect
sudo pacman -S psensor
psensor
RHEL/Fedora
sudo dnf install lm_sensors
sudo sensors-detect
sudo dnf install psensor
psensor
psensor now ships as a regular package on Fedora, skipping the old routine of compiling from a source tarball with gtk3-devel and other build dependencies. RHEL and CentOS-based systems may still need EPEL enabled first.
After installing psensor, execute psensor to run it.
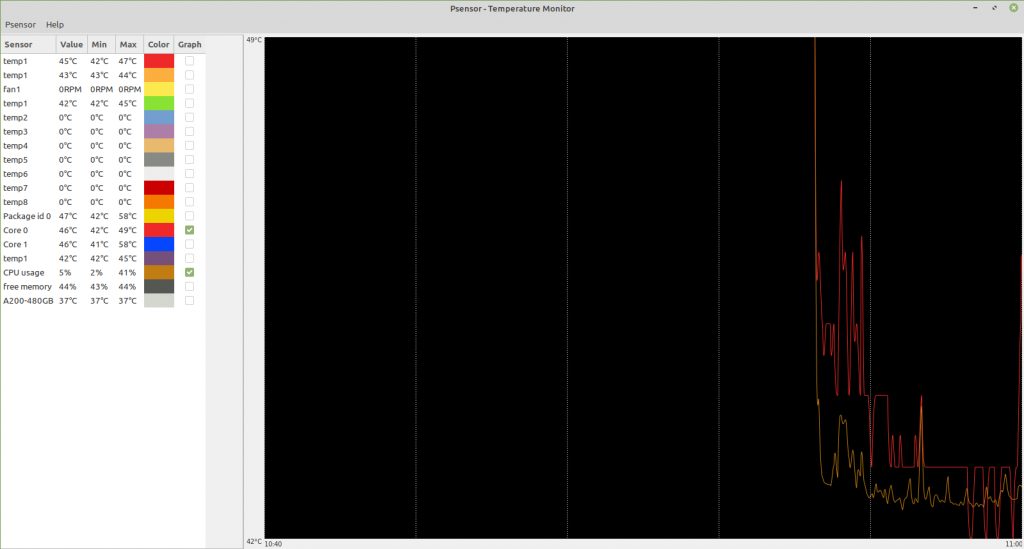
You can see the list of sensors (usually to the right by default) and select the ones that you want on a graph. Here I have plotted the temperature of the first core of my processor against the CPU usage. Double-click any sensor to set alarm thresholds, so psensor notifies you instead of needing the window open.
Launch it with psensor --hide-window and add that line to your desktop’s startup applications to keep it minimized on login.
GPU temperature
The methods above cover the CPU well, but GPU sensors work differently depending on the vendor, so it deserves its own section.
NVIDIA cards with the proprietary driver installed have the simplest path: nvidia-smi talks to the driver directly and skips lm-sensors entirely.
nvidia-smi --query-gpu=name,temperature.gpu --format=csv,noheader
lm-sensors generally can’t read NVIDIA cards on its own, since the open-source nouveau driver doesn’t expose the same sensor interface the proprietary driver does. If you’re on the proprietary driver and prefer a window over a terminal, nvidia-settings shows the same reading under its Thermal Settings tab, which is worth trying if nvidia-smi isn’t installed alongside the driver on your distro.
AMD cards are the opposite case. The amdgpu kernel driver registers with lm-sensors automatically in most cases, so a plain sensors command after installing lm-sensors usually already shows an amdgpu block with edge and junction readings, no extra setup required. If it’s missing, filter for it directly:
sensors | grep -i "edge\|junction"
Without using third-party apps
There is a way to get temperatures without using third-party applications like lm-sensors. In fact, this is the way, third-party applications like lm-sensors get their data and present it in a more accessible way.
To understand how this works, we need to understand that everything on Linux is a file. What this means is that we can access any modules, devices, is stored on the system as a file.
For example, if you want to know the brightness level of your caps-lock key, it’s stored in /sys/class/leds/input15\:\:capslock/brightness and you can read that file to know the brightness levels.
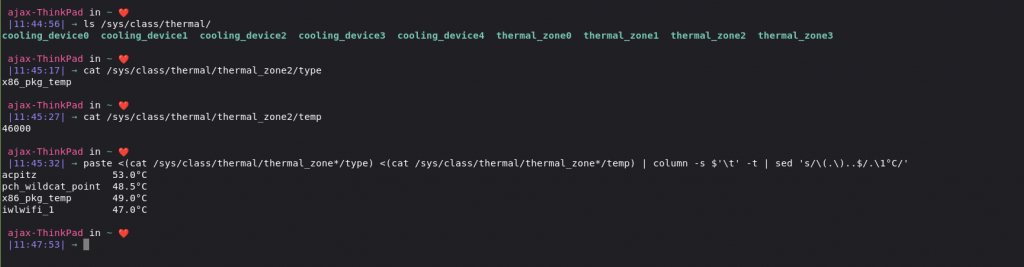
Similarly, all sensor data is stored in /sys/class/thermal/ various directories named thermal_zoneX. To get all the temperatures, run
cat /sys/class/thermal/thermal_zone*/temp
This will give you a list of temperatures in Celsius. To know what these temperatures represent, you can read a file named in each directory. For example to know what the first temperature represents, run
cat /sys/class/thermal/thermal_zone1/type
The CPU temperature is the thermal zone with type x86_pkg_temp.
You can also do some Linux string manipulation magic, and use the following command to list all types with their corresponding temperature.
paste <(cat /sys/class/thermal/thermal_zone*/type) <(cat /sys/class/thermal/thermal_zone*/temp) | column -s $'\t' -t | sed 's/\(.\)..$/.\1°C/'
A quick middle ground: acpi
If reading raw sysfs files feels like overkill but installing lm-sensors feels like too much, the small acpi utility sits in between. Install it with your package manager, then run acpi -t. It prints each thermal zone in plain language, no detection wizard required.
Disk and NVMe temperature
A cooling problem rarely stops at the CPU, and a hot drive is worth checking too, especially in a compact case with little airflow. hddtemp used to be the standard tool for this, but it’s no longer available in Ubuntu’s repositories from 22.04 onward. smartctl, part of the smartmontools package, is the current replacement and covers both spinning disks and NVMe drives.
sudo apt install smartmontools
sudo smartctl -A /dev/sda | grep -i temp
sudo smartctl -A /dev/nvme0 | grep -i temp
Both commands pull the reading from the drive’s SMART data, the same self-monitoring system that flags a drive’s developing faults, so it’s worth checking drive health at the same time. psensor can still show drive temperature too, through libatasmart rather than the retired hddtemp, so you don’t necessarily need a second tool running just for the disk.
Checking temperature on Raspberry Pi and other ARM boards
Plenty of LinuxForDevices readers are running headless boards rather than desktops, and Raspberry Pi OS ships its own one-shot reader that skips lm-sensors setup entirely.
vcgencmd measure_temp
That prints something like temp=48.3'C immediately, no detection step needed. The sysfs method from earlier works the same way on ARM, since cat /sys/class/thermal/thermal_zone0/temp reads the same way no matter the CPU architecture. To check whether the board has actually throttled since boot, a separate command reports it directly:
vcgencmd get_throttled
Any result other than 0x0 means the Pi hit a thermal or power limit at some point, worth knowing before you blame a script for running slow. Raspberry Pi boards typically start throttling around 80°C, lower than a desktop CPU, since the SoC has no fan by default.
Other tools worth knowing about
sensors and psensor cover most needs, but a few more tools come up often enough to mention:
- htop can show CPU temperature next to its process list. Press F2 for Setup, go to Display Options and enable “Also show CPU temperature”. It’s a clear step up from the plainer top command for day-to-day monitoring.
- btop folds temperature readouts into its resource graphs. It’s packaged for most major distros.
- Conky pins live sensor output to your desktop background once
sensorsis working, no terminal window needed.
What counts as a safe CPU temperature
There’s no universal number since Tj,max (the point where a chip starts throttling) is set per part by the vendor. Roughly, across common hardware, idle / under load / getting concerning:
- CPU (Intel): 30-45°C / 65-85°C / above 95°C
- CPU (AMD Ryzen, Tdie): 35-50°C / 70-90°C / above 95°C
- GPU: 30-50°C / 65-85°C / above 95°C
- NVMe SSD: 35-55°C / up to 70°C / above 80°C
Check your CPU’s datasheet for its actual Tj,max rather than trusting a generic figure. Server parts often run rated closer to 100-105°C with nothing wrong.
Troubleshooting: sensors finds nothing
Running sensors-detect and getting “no sensors were detected” is common on laptops, where thermal management runs through ACPI instead of chips lm-sensors can probe. Despite that message, plain sensors or acpi -t often still works, since ACPI is a separate path from lm-sensors’ chip probing. If neither helps, hardinfo (install it and launch it from the applications menu) reads temperature a different way and is worth trying. Rerunning sensors-detect after a kernel update can also pick up a module missed the first time.
Key takeaways
- Run
sensorsafter installing lm-sensors for the fastest terminal reading watch -n 2 sensorsgives a live-updating view without rerunning the command- On Ryzen, use
Tdiefor the real temperature, not the offsetTctlvalue nvidia-smireads NVIDIA GPUs,sensorsreads AMD GPUs automatically/sys/class/thermal/thermal_zone*/tempworks with zero packages installedhddtempis gone from Ubuntu 22.04+, usesmartctlfor drive temperaturevcgencmd measure_tempis the fastest check on a Raspberry Pi- Alert on a margin below your chip’s rated Tj,max, not a flat number for every CPU
Frequently asked questions
Why is lm-sensors not showing my CPU temperature?
Run sudo sensors-detect and answer yes to the prompts, then reboot so the detected kernel modules load. On laptops, ACPI often handles thermal data instead, so try acpi -t if sensors still comes back empty.
What is a normal CPU temperature on Linux?
Idle is typically 30-45°C and normal load runs 65-85°C for most desktop Intel and AMD chips. Above roughly 90-95°C the CPU is close to throttling on most consumer parts.
How do I check GPU temperature without a desktop environment?
Use nvidia-smi --query-gpu=temperature.gpu --format=csv,noheader for NVIDIA cards over SSH, or sensors | grep -i edge for AMD, since both work from a plain terminal with no GUI needed.
Does Tctl or Tdie matter more on AMD Ryzen?
Tdie is the real die temperature and the one to monitor. Tctl includes a vendor-added offset for fan-curve headroom that can run 10-27°C higher, so it isn’t the number that indicates actual heat.
Why did hddtemp stop working after I updated Ubuntu?
hddtemp was dropped from Ubuntu’s repositories starting with 22.04. Install smartmontools instead and read drive temperature with sudo smartctl -A /dev/sda | grep -i temp.
Can I check CPU temperature on a Raspberry Pi the same way?
Mostly. The /sys/class/thermal files work the same on ARM, and Raspberry Pi OS also ships vcgencmd measure_temp as a one-command shortcut needing no setup.
Conclusion
We have seen several ways to check hardware temperature on Linux, from a single command to full dashboards. If you want to learn more about CPU optimization, visit Cpu Frequency Scaling. Have fun!