

To read system activity in Linux, use vmstat to compare repeated reports. The command presents process queues and system activity in a compact report.
I’ll show how to collect and interpret vmstat samples, then explain the limits of its output.
TL;DR: What vmstat Shows in Linux
Run vmstat -y 1 2 for two one-second samples without the since-boot report. Compare rows to decide whether a signal persists.
- Check several rows for persistent changes.
- Use a focused tool when you need detail beyond system-wide activity.
What is vmstat in Linux?
vmstat is a procps command that reports process queues, memory, swap, block input and output, system events, and CPU activity. It reads kernel statistics and presents a compact system-wide view.
The r column counts runnable processes and b counts those in uninterruptible sleep. Memory fields show amounts, while si, so, bi, bo, in, and cs are rates. CPU fields divide time among user work, kernel work, idle time, I/O wait, and virtual-machine steal time.
The procps manual says the first report combines activity averages since boot with current process and memory readings. Later reports describe the elapsed sampling interval.
How to use the vmstat command step by step
Start with repeated samples. I ran bash vmstat-sample.sh, which returned two interval rows without the since-boot report.
Step 1: Take a short interval sample
The delay sets seconds between reports and the count sets how many reports to print. This command samples once per second and stops after two rows:
bash vmstat-sample.sh
procs -----------memory---------- ---swap-- -----io---- -system-- -------cpu-------
 r  b   swpd   free   buff  cache   si   so    bi    bo   in   cs us sy id wa st gu
 0  0 3209328 481392 459384 5937824    0    0     0     0 2063 2912  9  3 88  0  0  0
 8  0 3209328 450960 459384 5937824    0    0     0     0 2352 2328 32  6 62  0  1  0
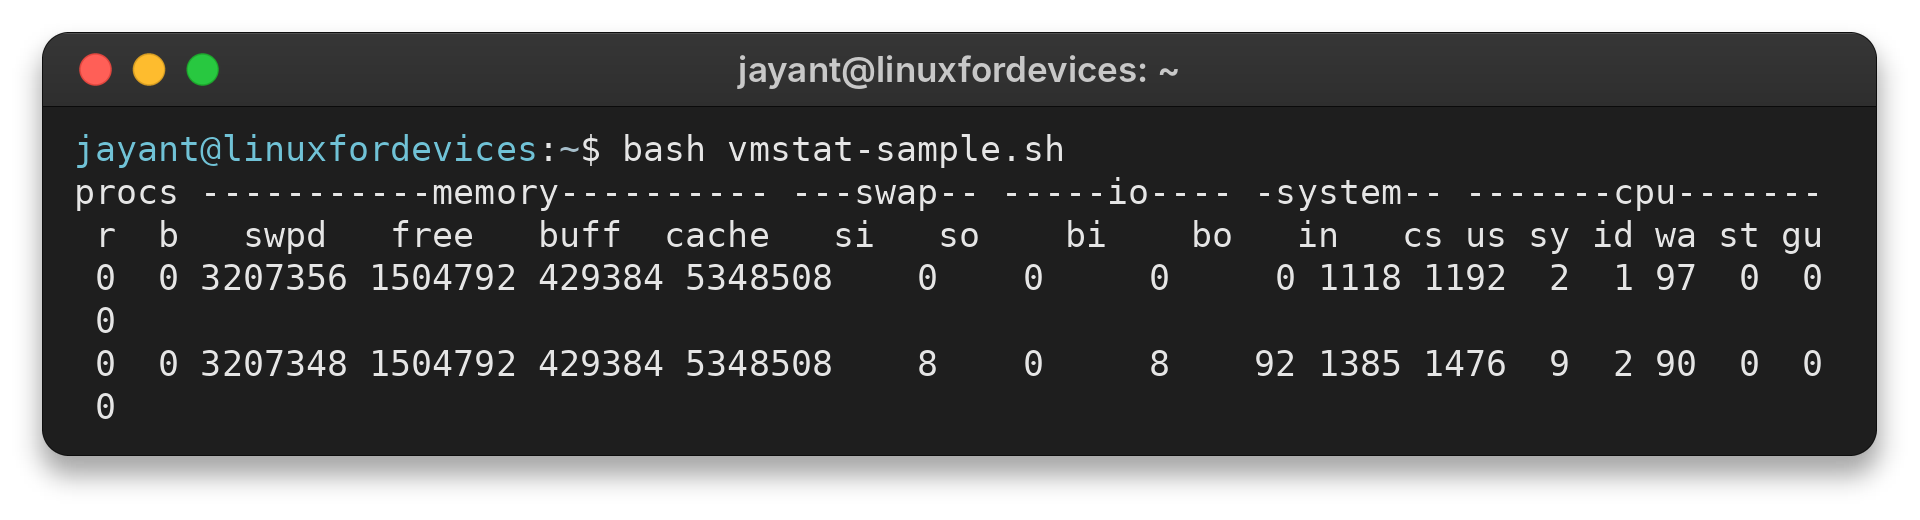
The two data lines are separate samples. Here free and cache change, while si and so remain zero.
Step 2: Check the process and CPU columns
Compare r with the workload and use wa to check for time idle while I/O is pending.
bash vmstat-sample.sh
procs -----------memory---------- ---swap-- -----io---- -system-- -------cpu-------
 r  b   swpd   free   buff  cache   si   so    bi    bo   in   cs us sy id wa st gu
 0  0 3209328 481392 459384 5937824    0    0     0     0 2063 2912  9  3 88  0  0  0
 8  0 3209328 450960 459384 5937824    0    0     0     0 2352 2328 32  6 62  0  1  0
Compare r with the workload and low idle time before investigating CPU pressure.
Step 3: Read memory, swap, and I/O together
swpd is swapped-out virtual memory and free is unused physical memory. si and so show swap rates, while bi and bo show block-device transfers. Sustained so alongside other pressure signals matters more than one sample.
For memory totals, use the free command in Linux.
The top command provides process detail.
Step 4: Choose options for readable monitoring
The -y and -w flags change report formatting, while -t appends timestamps. For timestamped two-second samples, run the command below.
vmstat -y -t 2 5
Use the installed command’s help or manual to confirm available modes. Disk-specific statistics call for a device-level tool such as iostat.
vmstat output limits and common mistakes
Column values describe system activity, not a diagnosis by themselves.
| What you see | How to read it | Next check |
|---|---|---|
| First report looks unlike later rows | Activity fields are averaged since boot in the initial report | Use -y for interval-only samples |
| free looks low | One field does not show the full memory picture | Compare free, cache, and swap. check free output |
| si or so stays above zero | Swap activity continues during sampling | Check memory totals and the workload |
| wa rises | CPU time is waiting for I/O | Use disk-specific tools such as iostat |
| Unknown option error | The option may be misspelled or absent in this version | Run vmstat -.-.help and check the manual |
I ran vmstat --bad-option and got exit status 1: “vmstat: unrecognized option "--bad-option"”. Check the spelling, then select a listed flag.
Review Linux memory management for RAM and swap concepts.
Conclusion
Use repeated vmstat samples to separate a persistent system signal from a single observation. The vmstat manual page documents flags and field behavior, and the procps project maintains the utilities.
FAQ
These quick answers cover the first report and the basic sampling syntax.
What does the first vmstat report show?
Its activity values are averages since the last boot, while process and memory fields show current readings. Use -y to omit that report when measuring intervals.
How do I run vmstat every second?
Run vmstat 1 for continuous one-second reports, or vmstat 1 5 for five reports and then stop. The first report contains since-boot activity unless you add -y.
Does vmstat show which process uses the most memory?
No. It reports system-wide statistics. Use a process viewer such as top when you need process-level details.