

- the current time
- the total uptime
- the number of active users and
- the average system loads for the past 1, 5 and 15 minutes.
A one-minute load average higher than the longer-window averages means demand has risen recently. I can’t resist digging into how much that compact signal reveals about system activity without naming a cause.
Find where the load averages appear in the default `uptime` line. Relate those values to the report’s elapsed time since boot.
What uptime reports
The uptime command combines the system clock with time since boot and the number of logged-in users. It also prints three load averages that describe recent scheduling demand.
System uptime starts at the last boot. It does not tell you whether a package was updated or whether a specific service is healthy.
| Field | What it reports | What it does not establish |
|---|---|---|
| Clock | The system time when the command ran | How long the system has been running |
| Up | Elapsed time since the latest boot | A service’s own running time |
| Users | Logged-in user count | The number of processes |
| Load average | Average runnable or uninterruptible tasks over three windows | CPU use as a percentage |
Check which options your uptime build supports
Run the help option to see the flags exposed by the installed uptime program. The upstream manual can document options that a particular build does not list, so use the local help output when choosing a flag.
uptime --help
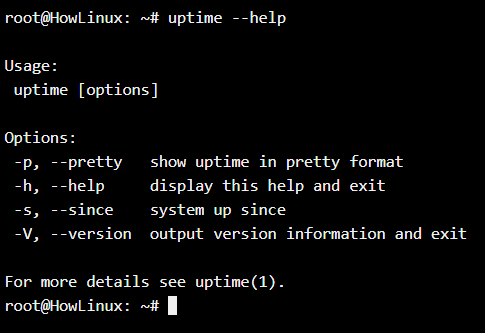
The man command guide explains how to read a manual page when you need a longer option description.
Read the default uptime line
Run uptime without an option to print the full status line. The example shows one captured result, and its clock, boot age, user count, and load values will differ on another system.
uptime

The first value is the system clock, while the text after “up” is elapsed time since boot. The user count is not a process count, and the three load values map to the 1-, 5-, and 15-minute windows.
| Output part | Read it as |
|---|---|
| Time before “up” | Clock value at command execution |
| Duration after “up” | Time since the system booted |
| User count | Logged-in users reported by the system |
| Three load values | 1-, 5-, and 15-minute load averages |
If the clock looks wrong, compare it with the Linux date command, which prints the system’s date and time in configurable formats.
Choose an uptime option by question
The flags answer different questions, so use the one that matches the value you need rather than treating them as alternate formats for the same result.
Show only readable elapsed time
The pretty option returns the elapsed time as a short phrase and leaves out the clock, user count, and load averages. Use it when boot age is the only value you need.
uptime -p
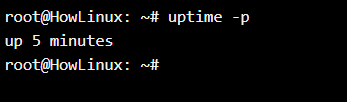
Find when the system last booted
The since option prints the date and time the system came up. Compare that timestamp with maintenance records if you need to know whether a reboot followed an update.
uptime -s

A system restart resets this value. The Linux system restart guide covers reboot commands and what to check before using them.
Check the uptime program version
I ran the command with -V and got “uptime from procps-ng 4.0.4.” That identifies the utility’s version, not how long Linux has been running.
uptime -V

Read load average as system demand, not CPU percentage
A Linux load average counts tasks that are runnable or in uninterruptible sleep. Runnable tasks are using a CPU or waiting for one, while uninterruptible tasks can be waiting for I/O.
The procps-ng uptime manual says these averages cover 1, 5, and 15 minutes and are not normalized by CPU count. A load value is therefore not a CPU percentage, and one is not a universal saturation threshold.
cat /proc/loadavg

| Field | Meaning |
|---|---|
| First | One-minute load average |
| Second | Five-minute load average |
| Third | Fifteen-minute load average |
| Fourth | Currently runnable tasks divided by total scheduling entities |
| Fifth | PID of the last-created process |
The proc_loadavg manual defines the trailing fields. The Linux kernel /proc documentation describes the same interface, and the cat command guide shows how to read files such as /proc/loadavg.
A rising one-minute average beside lower five- and fifteen-minute values means load has increased recently. The numbers show demand, but they do not identify which process or resource caused it.
Follow a rising load to the waiting work
Use top for a process-level view when the load average stays high. Its CPU and task summaries help narrow the next check, while the Linux top command guide explains how to read its display.
top -b -n 1
Uptime cannot tell you whether an individual service is healthy. If that is the question, use the service management guide to inspect the unit rather than treating system boot age as service status.
Frequently asked questions
Can Linux load average exceed the CPU count?
Yes. Linux load average is not normalized by CPU count and includes runnable or uninterruptible tasks, including tasks waiting for I/O. It is not a CPU percentage.
Does uptime show whether a service is running?
No. Uptime reports system boot age and load, not the state or start time of an individual service.
What does uptime -s show?
It prints the date and time the system last booted, in a year-month-day and hour-minute-second format.